Central African Republic Economy in Graphs
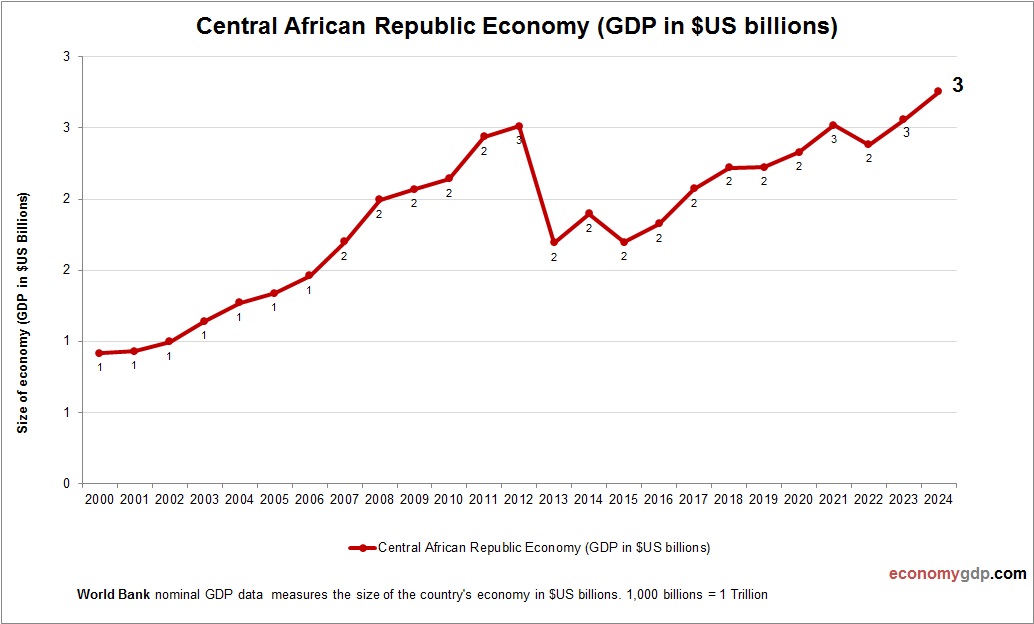
The Central African Republic economy is one of the worlds least developed, relying on subsistence agriculture, diamonds, and timber. Small-scale farming dominates, while diamond exports provide limited revenue. Ongoing conflict, weak governance, and lack of infrastructure severely hamper growth. Humanitarian View diagram Central African Republic Economy in Graphs