
Tanzanias PPP GDP was $252.7 billion in 2023. Agriculture, mining, and tourism drive growth, with GDP per capita (PPP) at $3,600. Stable governance supports trade, but poverty and infrastructure gaps remain. Gas projects and tourism are key for development.
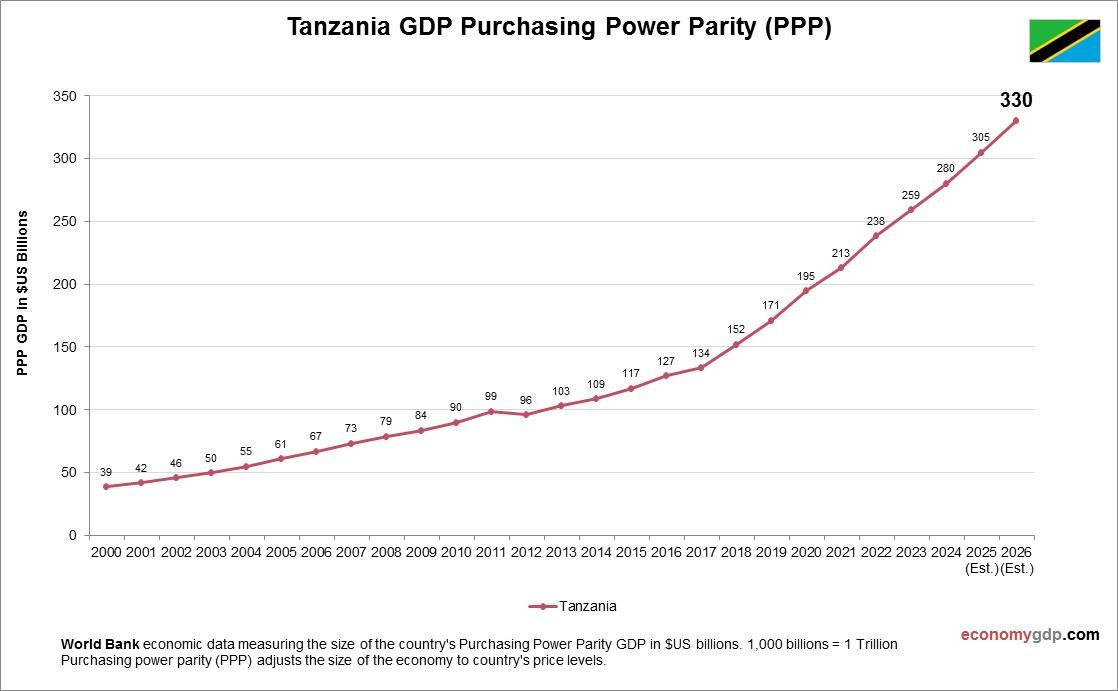
Tanzania GDP PPP Statistics by Year
| Year | GDP, Purchasing Power Parity (PPP) |
| 2000 | 38.7 |
| 2001 | 42.0 |
| 2002 | 45.7 |
| 2003 | 49.7 |
| 2004 | 54.9 |
| 2005 | 60.8 |
| 2006 | 66.8 |
| 2007 | 73.2 |
| 2008 | 78.9 |
| 2009 | 83.6 |
| 2010 | 89.9 |
| 2011 | 98.8 |
| 2012 | 95.8 |
| 2013 | 103.2 |
| 2014 | 108.6 |
| 2015 | 117.0 |
| 2016 | 127.2 |
| 2017 | 133.5 |
| 2018 | 152.0 |
| 2019 | 171.1 |
| 2020 | 194.6 |
| 2021 | 212.8 |
| 2022 | 238.4 |
| 2023 | 259.5 |
| 2024 | 280.4 |
| 2025 (Est.) | 305.0 |
| 2026 (Est.) | 330.0 |