


Croatia Children Per woman
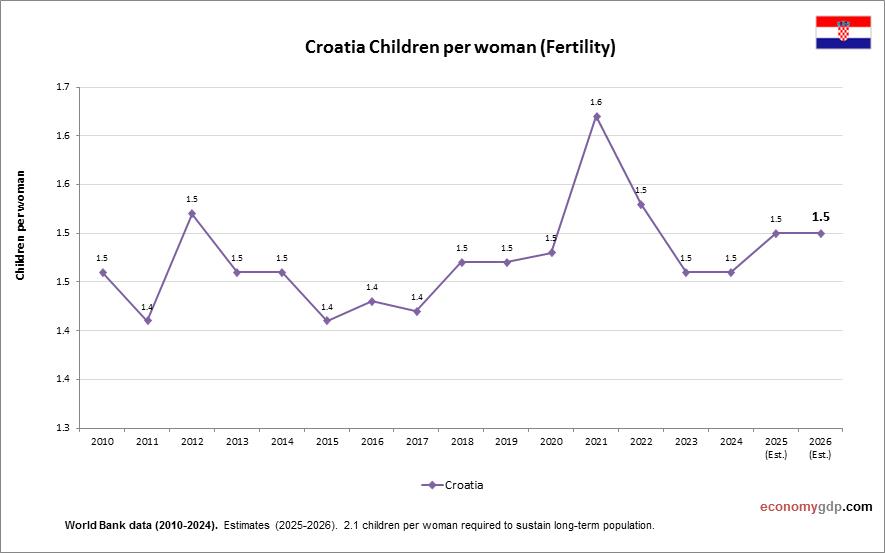
This diagram presents Croatia Children Per woman. The fertility rate statistics are compiled by World Bank. Based on the latest available information for Croatia. Croatia has a low number of children per woman, consistent with broader European trends. Aging population, View diagram Croatia Children Per woman