Skip to content
cropped-economygdp.jpg

Economy GDP

World economy charts, business frameworks and diagrams

Menu

Primary menu

  • Economy
    • Top Economies
  • Demographics
  • Business
    • Strategy
    • Project Management
    • Industry Examples
    • Leadership
    • HR
    • Industry Examples
  • Framework
  • Analysis
  • Lean Six Sigma
    • Lean
  • IT
    • Social Media
  • Marketing
  • Stories
  • Top

Tag Archives: South Asia statistics

South Asia Children Per woman

South Asia Children Per woman

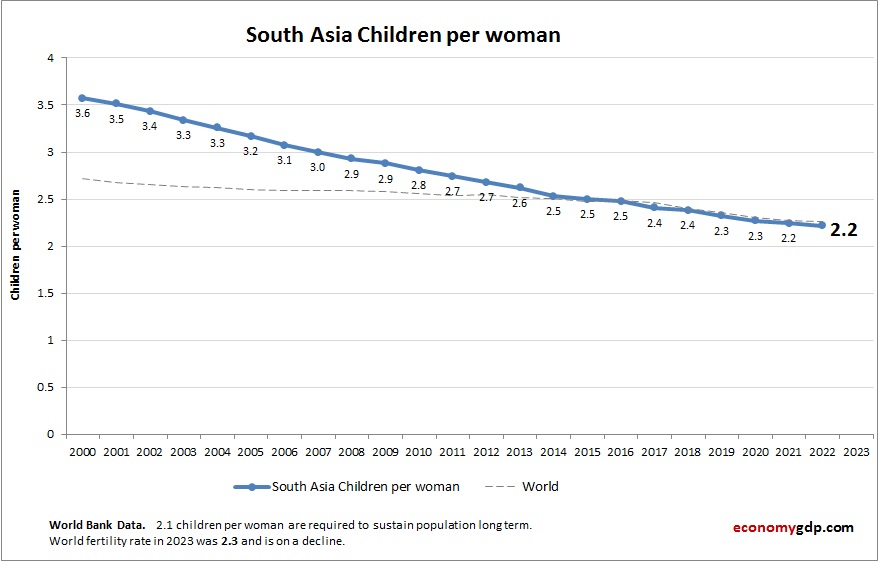
The above graph shows South Asia Children Per woman. This is according to World Bank birth stats by country. Latest births per woman information for South Asia. South Asia has experienced a sharp fertility decline over recent decades. Economic development, View diagram South Asia Children Per woman→

Posted in Demographics | Tagged South Asia demographics, South Asia statistics

South Asia GDP Purchasing Power Parity

South Asia GDP Purchasing Power Parity

South Asia economy graph showing purchasing power parity (PPP) growth from 2000 to today. Purchasing power parity adjusts the size of the economy to relevant price levels, i.e. measuring the price of specific goods in different countries and adjusting GDP View diagram South Asia GDP Purchasing Power Parity→

Posted in Economy | Tagged South Asia, South Asia economy, South Asia gdp, South Asia statistics

Primary Sidebar Widget Area

Top Diagrams

Latest Posts

  • Niger GDP
  • Guinea Inflation
  • Sierra Leone GDP Purchasing Power Parity
  • Lebanon Economy
  • Strategic Analysis Methods
  • Malaysia Children Per woman
  • Greece Inflation
  • Dominican Republic Fertility Rate
  • Montenegro Children Per woman
  • Tanzania GDP PPP
  • Tunisia GDP PPP
  • Kosovo GDP
  • Process Improvement Project
  • Mali GDP Purchasing Power Parity
  • Four Data Analysis Techniques
  • Twitter
Copyright © 2026 Economy GDP. All Rights Reserved.
Theme: Catch Box by Catch Themes
Scroll Up