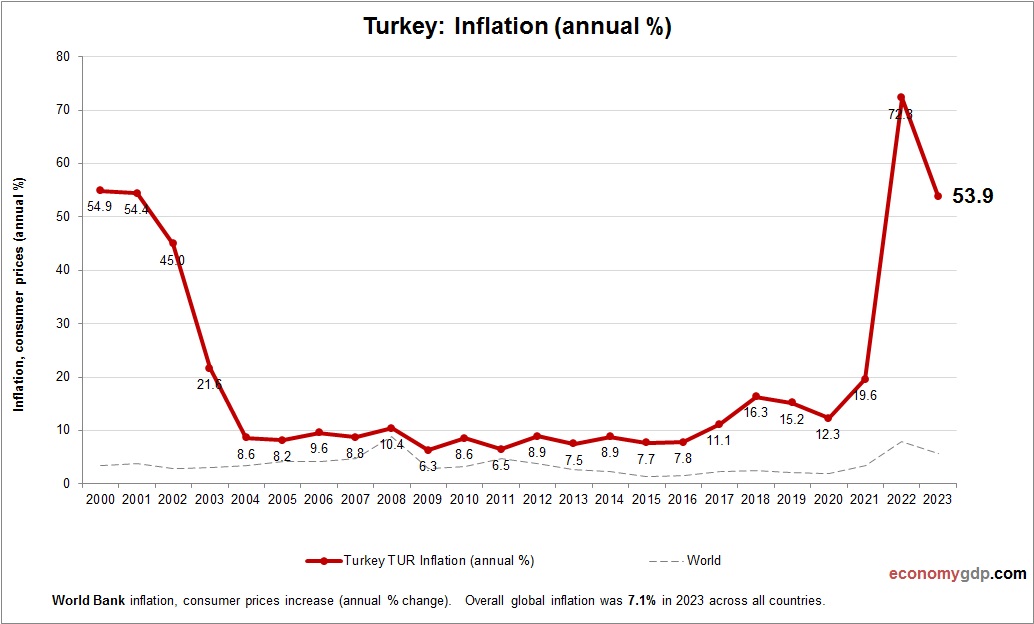
Yemen GDP

Yemen GDP

Yemen's war-torn economy, with a GDP of $21.89 billion, faces contraction. Agriculture employs many, while oil and gas dominate exports, with wheat and petroleum as imports. Poverty, unemployment, and water scarcity are severe challenges. Recent Houthi policies and reliance on View diagram Yemen GDP

Peru Inflation

Peru Inflation

This graph shows Peru Inflation. This is according to World Bank consumer price index stats by country. Based on the latest available information for Peru. Peru’s inflation is driven by food and energy prices, supply chain issues, and political uncertainty View diagram Peru Inflation

Georgia GDP per capita

Georgia GDP per capita

This diagram presents Georgia GDP per capita. The economic data is provided by World Bank. Based on the latest economic info provided for Georgia. Georgia’s GDP per capita has shown gradual improvement, driven by sectors like agriculture, tourism, and services. View diagram Georgia GDP per capita

Italy Inflation

Italy Inflation

This diagram presents Italy Inflation. The consumer price statistics are compiled by World Bank. Based on the latest economic data provided for Italy. Italy’s inflation is driven by energy prices, supply chain disruptions, and labor market dynamics, with EU-wide economic View diagram Italy Inflation