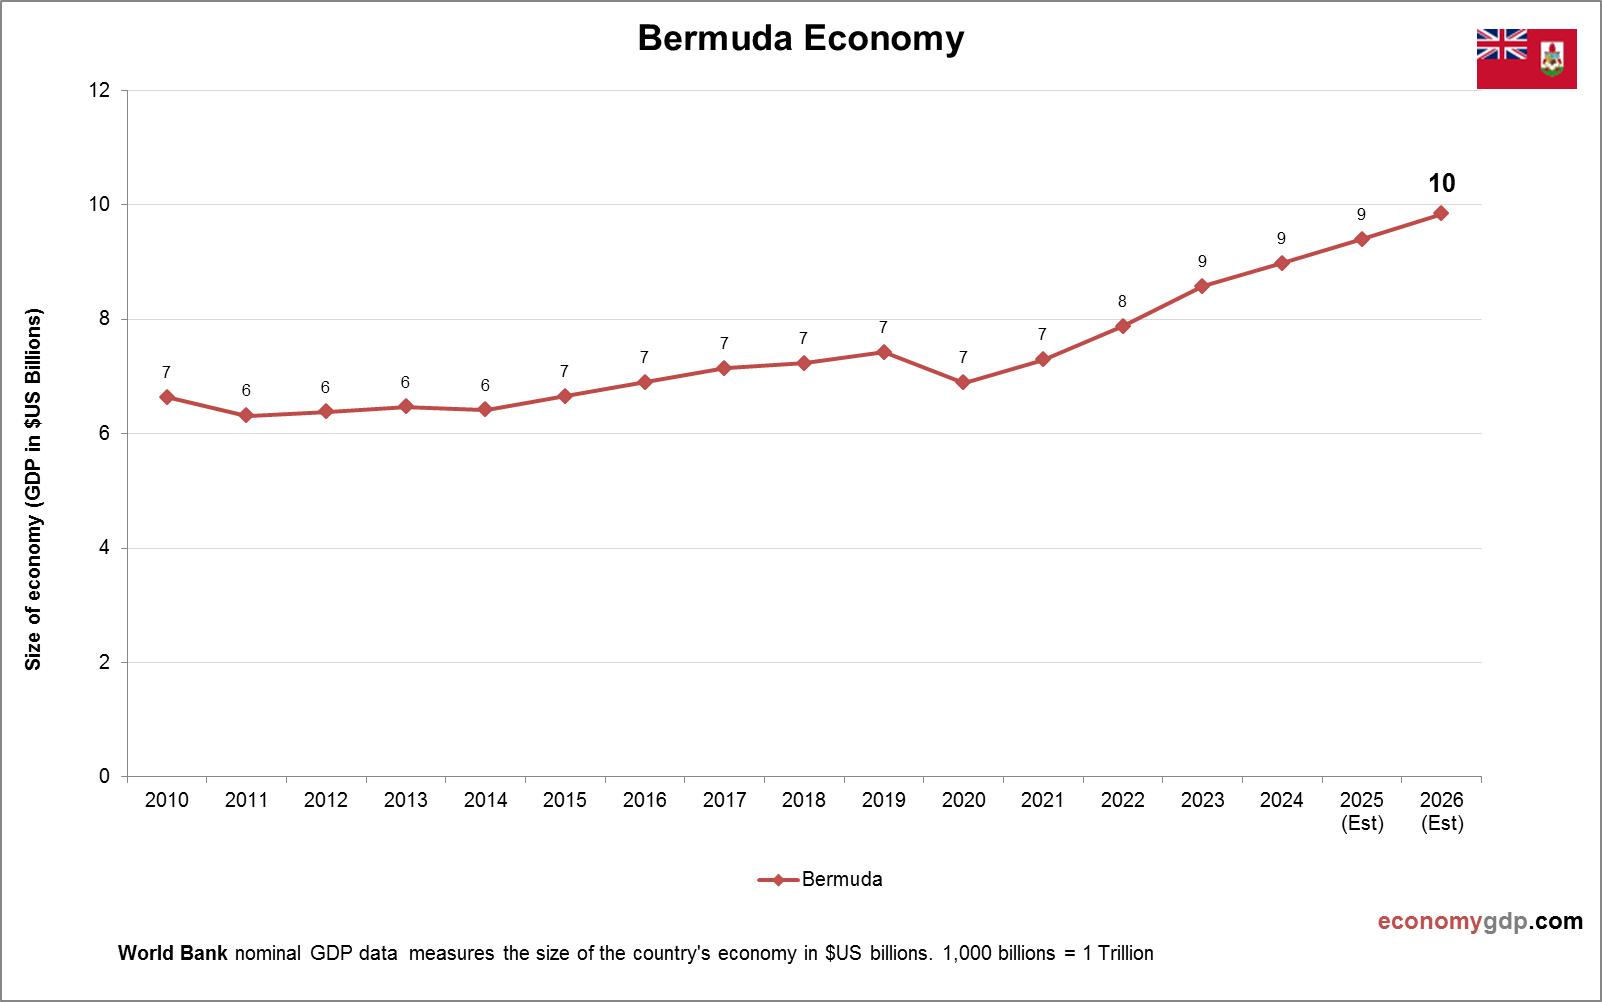
St. Kitts and Nevis GDP per capita

This diagram presents St. Kitts and Nevis GDP per capita. This is according to World Bank GDP stats by country. Based on the latest available information for St. Kitts and Nevis. St. Kitts and Nevis’ GDP per capita in 2024 View diagram St. Kitts and Nevis GDP per capita

New Zealand Inflation

This chart demonstrates New Zealand Inflation. Inflation data is sourced from World Bank. Based on the latest available information for New Zealand. New Zealand experiences inflation from housing price growth, global energy costs, and strong post-pandemic consumer demand. Being geographically View diagram New Zealand Inflation

Solomon Islands GDP per capita

This diagram presents Solomon Islands GDP per capita. The economic data is provided by World Bank. Latest GDP per person information for Solomon Islands. The Solomon Islands’ GDP per capita in 2024 is estimated at approximately $2,500. The economy is View diagram Solomon Islands GDP per capita

Burkina Faso Inflation

This chart demonstrates Burkina Faso Inflation. The consumer price statistics are compiled by World Bank. Change in consumer prices for Burkina Faso. Inflation in Burkina Faso is rooted in food insecurity, conflict-related disruptions, and reliance on agricultural imports, making it View diagram Burkina Faso Inflation

Solomon Islands Inflation

This chart demonstrates Solomon Islands Inflation. The consumer price statistics are compiled by World Bank. Based on the latest available information for Solomon Islands. Inflation in the Solomon Islands stems from reliance on imported goods, high shipping costs, and agricultural View diagram Solomon Islands Inflation

East Asia & Pacific Inflation

This chart demonstrates East Asia & Pacific Inflation. The consumer price statistics are compiled by World Bank. Based on the latest economic data provided for East Asia & Pacific. Inflation in East Asia & Pacific is shaped by energy and View diagram East Asia & Pacific Inflation