Skip to content
cropped-economygdp.jpg

Economy GDP

World economy charts, business frameworks and diagrams

Menu

Primary menu

  • Economy
  • Demographics
  • Business
    • Strategy
    • Project Management
    • Industry Examples
    • Leadership
    • HR
    • Industry Examples
  • Framework
  • Analysis
  • Lean Six Sigma
    • Lean
  • IT
    • Social Media
  • Marketing
  • Top

Category Archives: Lean

Simplex Diagram

Simplex Diagram

Lean six sigma simplex model is a method of analyzing and fixing problems starting with problem finding, fact finding, problem definition, idea finding, selection, planning, sell idea, action. The simplex cycle repeats. The below diagram explains the simplex method.

Posted in Lean | Tagged simplex, simplex cycle, simplex lean six sigma, simplex lss, simplex method

Lean six sigma belts pyramid

Lean six sigma belts pyramid

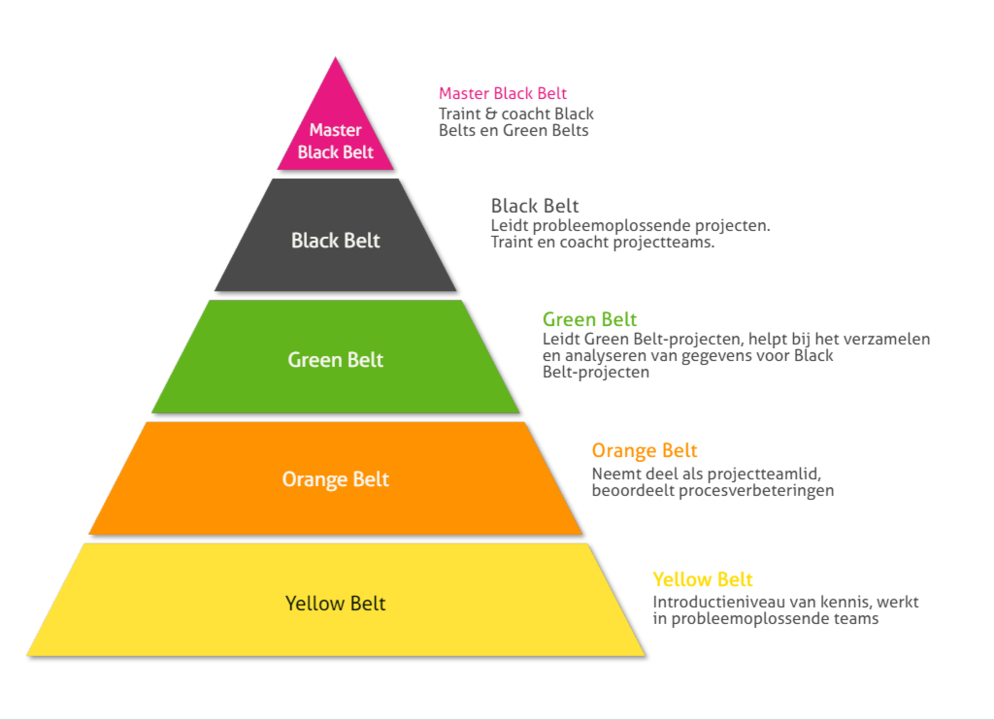
Lean six sigma diagram explaining lss belts progression from yellow belt to master black belt. The pyramid shows the belts one must go through to achieve lean six sigma designation.

Posted in Lean | Tagged lean six sigma belts, lss belts, lss certification, lss certification pyramid

TPM Total Productive Maintenance

TPM Total Productive Maintenance

Total Productive Maintenance is a lean six sigma framework that stands on 5 pillars that are elimination of main problems, autonomous maintenance, planned maintenance, early management of new equipment, education & training on the job. TPM framework below also lists View diagram TPM Total Productive Maintenance→

Posted in Lean | Tagged total productive maintenance, tpm, tpm diagram, tpm lean six sigma, tpm lss

LSS Histogram

LSS Histogram

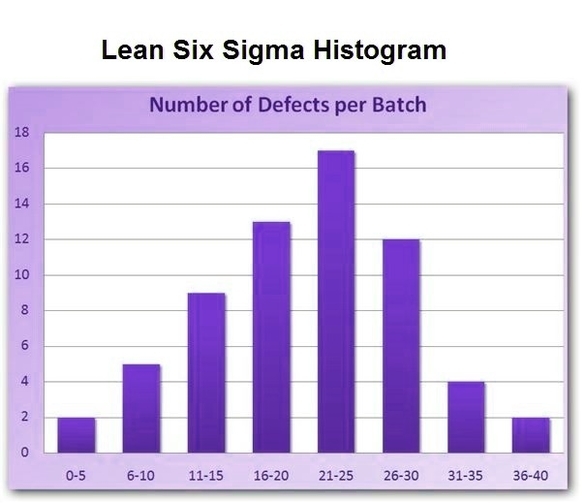
A sample lss histogram below shows number of defects per batch. Lean six sigma histograms are a good graphic representation of various data points such as defects widely used by the lss methodology.

Posted in Lean | Tagged lean six sigma histogram, lss histogram, process histogram

Push vs pull system

Push vs pull system

Push vs pull system diagram below explains the difference between two key lean six sigma process types. Push system is when material is pushed into downstream workstations regardless of whether resources are available. Pull system – materials are pulled to View diagram Push vs pull system→

Posted in Lean | Tagged pull system, push system, push vs pull, push vs pull lss

Lean Six Sigma Design Principles

Lean Six Sigma Design Principles

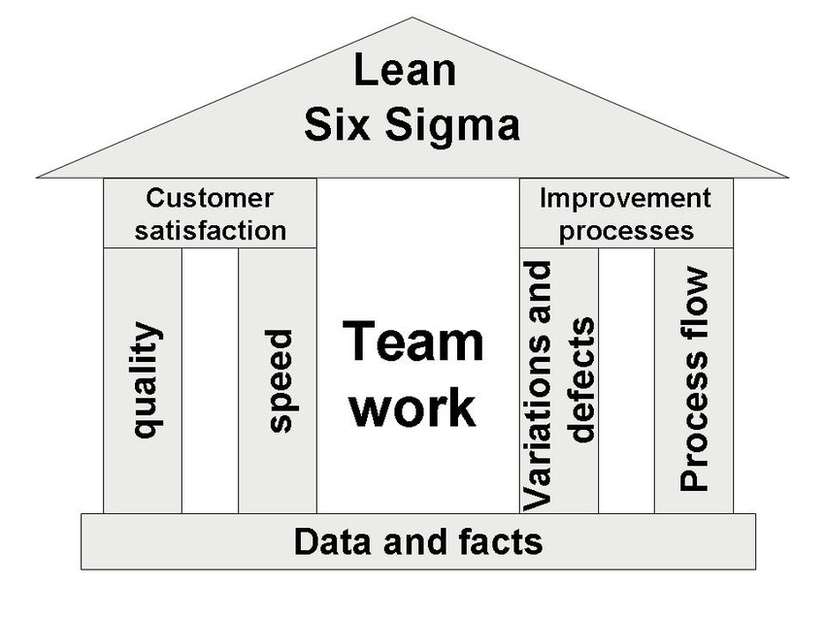
Lean six sigma design principles include quality, speed to increase customer satisfaction, decreasing variations and defects, improving process flow while heavily relying on data and facts and doing it all through effective team work. The LSS design principles diagram below View diagram Lean Six Sigma Design Principles→

Posted in Lean | Tagged lean six sigma design principles, lss design principles, lss principles

PDCA cycle

PDCA cycle

PDCA cycle stands for Plan, Do, Check, and Act. Plan for change to bring about improvement, Do change on a small scale first to try them, check to see if changes are working and investigate selected processes, act to get View diagram PDCA cycle→

Posted in Lean | Tagged lss pdca, pcda cycle diagram, pdca

Sipoc flow example

Sipoc flow example

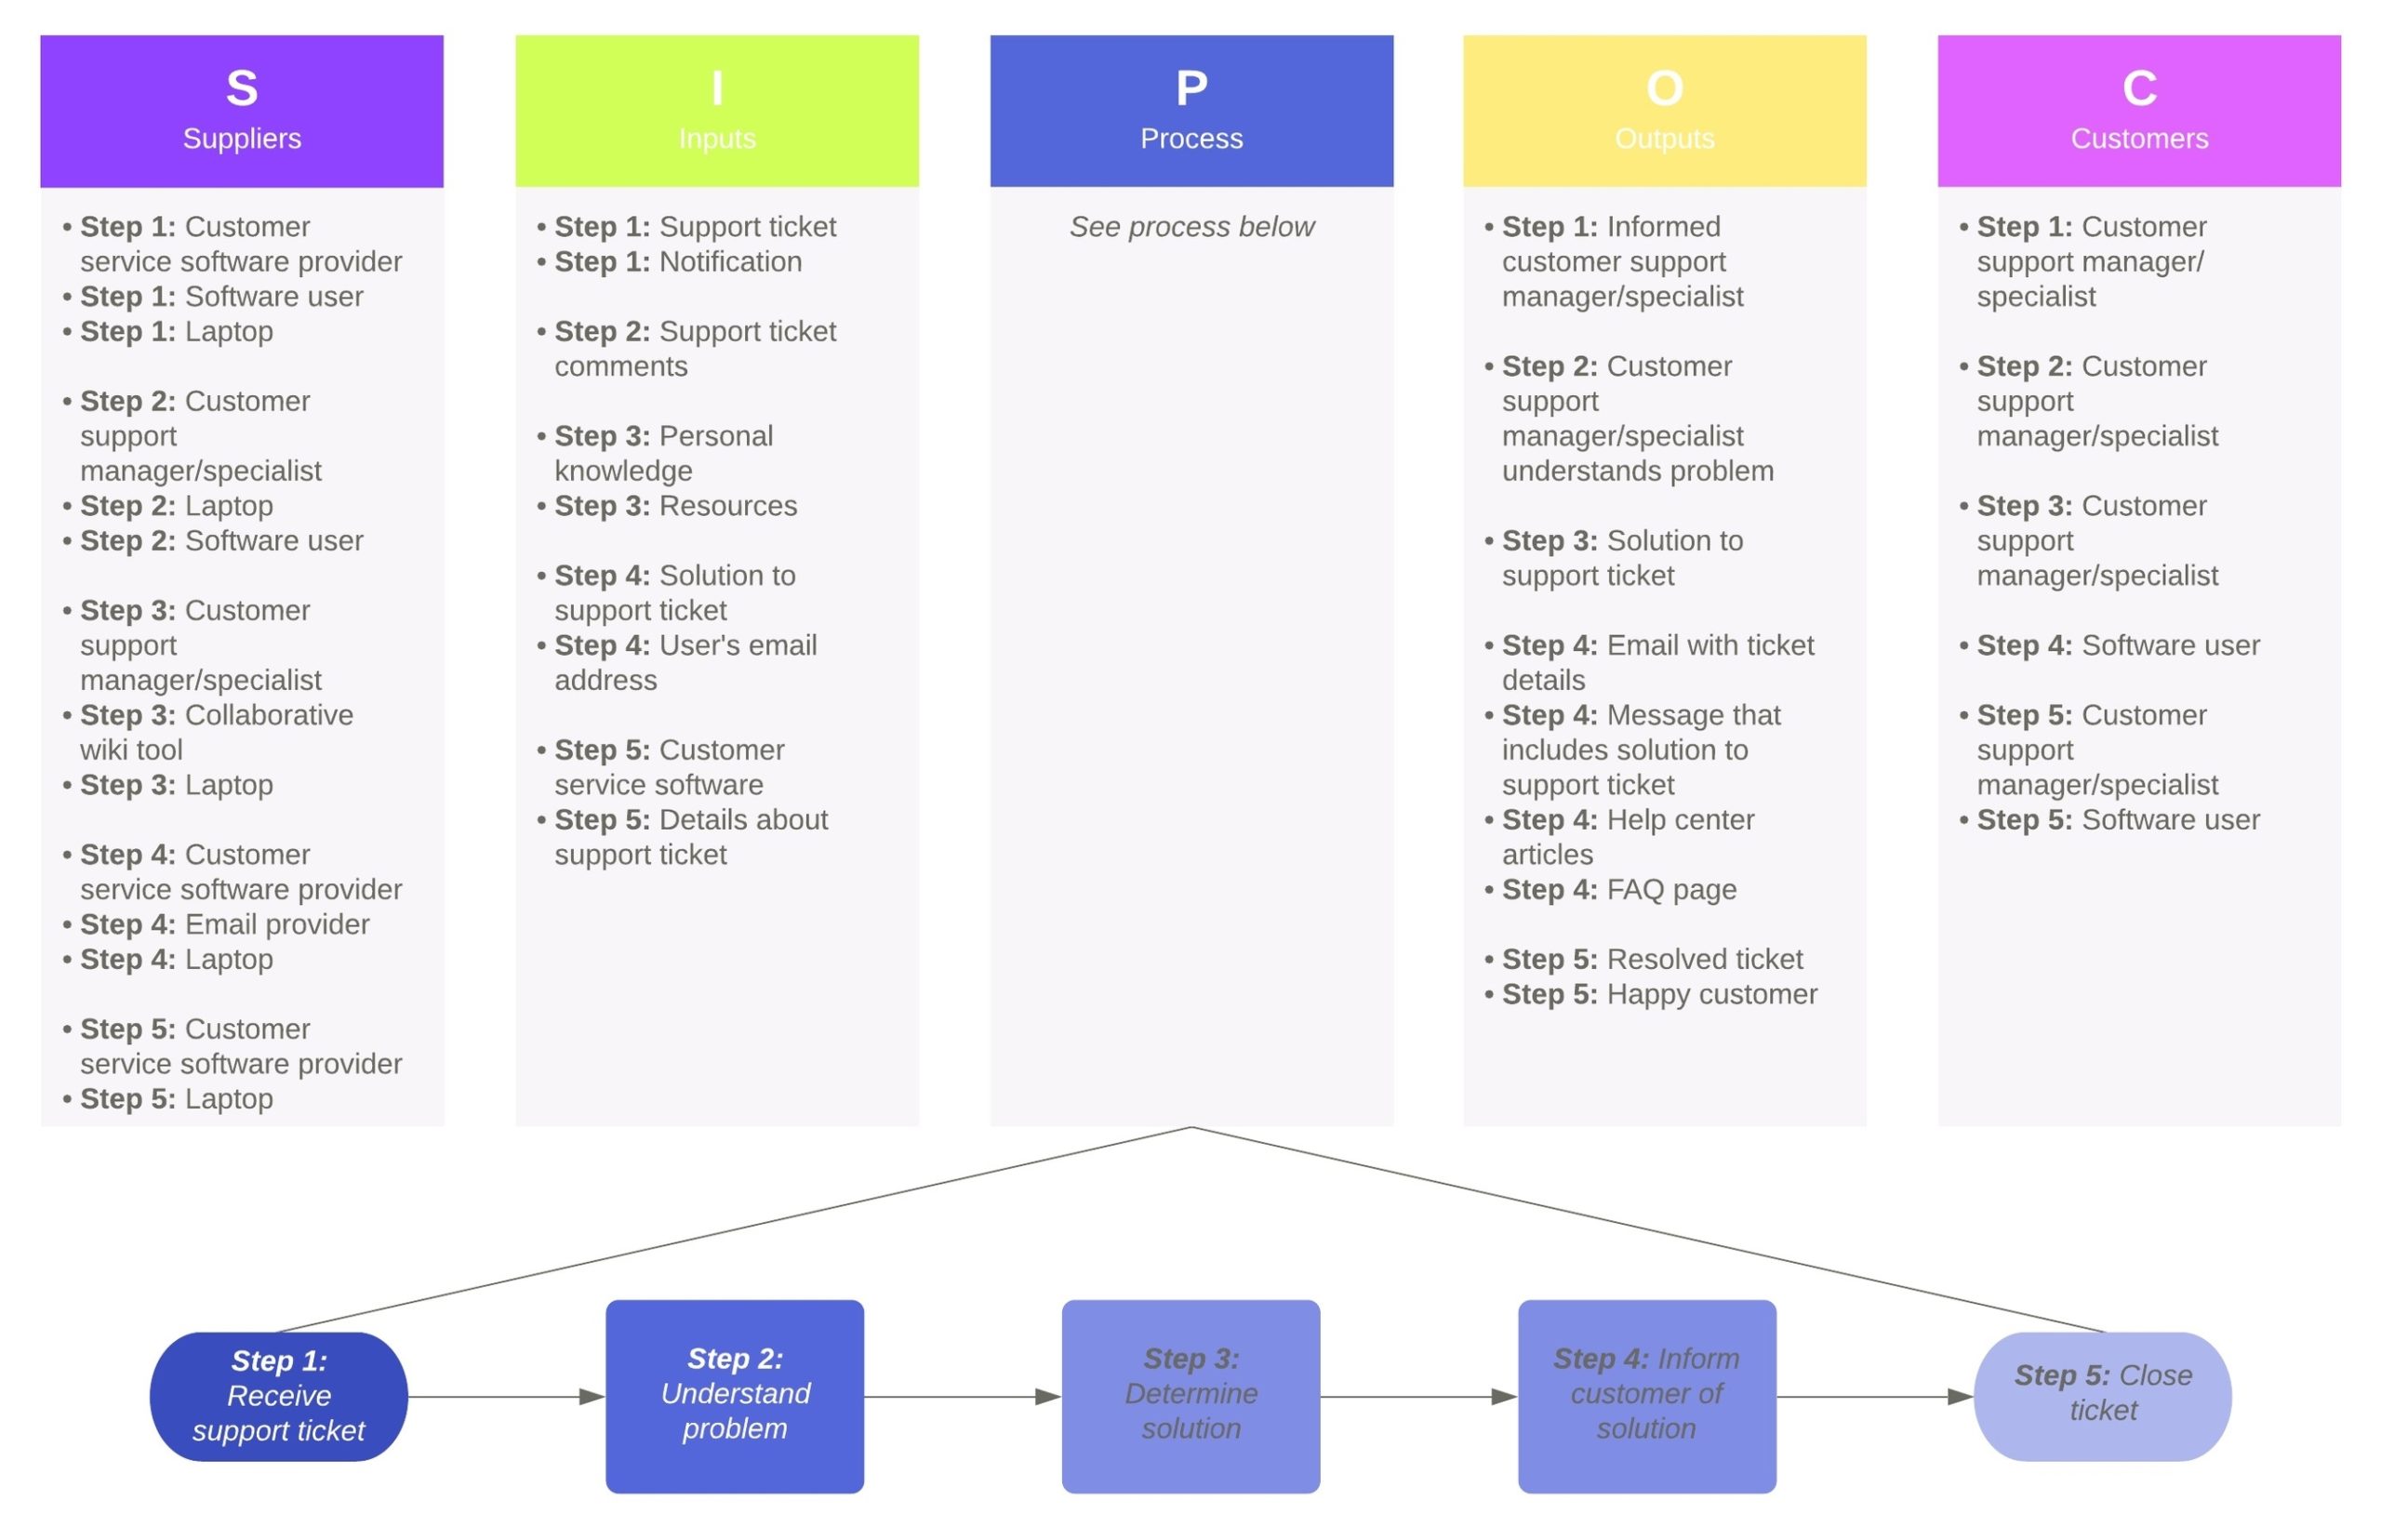
Sipoc is a lean six sigma tool that helps map the process at a high level while stating who the suppliers are, what are the inputs, what is the process, what are outputs and customers. SIPOC is a great tool View diagram Sipoc flow example→

Posted in Lean | Tagged sipoc, sipoc diagram, sipoc example, sipoc flow

DMAIC tools for each phase

DMAIC tools for each phase

DMAIC Phase Tools Used: Define – Define project goals and customer deliverables, develop Problem Statement, Goals and Benefits; Identify Process Owner and Team Members; Define Resources; Develop Project Plan and Key Milestones By using Lean Six Sigma DMAIC approach, companies View diagram DMAIC tools for each phase→

Posted in Lean | Tagged dmaic, dmaic approach, dmaic explained, dmaic lean six sigma, dmaic phases, dmaic tools

SIPOC example

SIPOC example

SIPOC is a high level process map and is explained here with a SIPOC diagram sample. Learn how to create SIPOC for your project in 7 simple steps. SIPOC stands for Suppliers, Inputs, Process, Outputs and Customers.

Posted in Lean | Tagged sipoc, sipoc example, sipoc lean six sigma, sipoc sample, sipox explained, what is a sipoc

Post navigation

← Older posts

Primary Sidebar Widget Area

Top Diagrams

Latest Posts

  • Mexico Economy in Graphs
  • South Korea Economy in Graphs
  • Russia Economy in Graphs
  • Canada Economy in Graphs
  • Brazil Economy in Graphs
  • Italy Economy in Graphs
  • France Economy in Graphs
  • United Kingdom Economy in Graphs
  • Japan Economy in Graphs
  • China Economy in Graphs
  • United States Economy in Graphs
  • Children Per woman
  • Africa Western and Central GDP per capita
  • Germany Economy in Graphs
  • Lebanon Inflation

Top Tags

  • business strategy (30)
  • marketing strategy (25)
  • digital strategy (24)
  • IT strategy (24)
  • IT strategy framework (21)
  • digital strategy framework (20)
  • business model (19)
  • digital framework (19)
  • it framework (19)
  • technology strategy (19)
  • risk management (18)
  • marketing framework (17)
  • business model framework (16)
  • change management (16)
  • change management diagram (16)
  • change management framework (16)
  • leadership diagram (16)
  • marketing diagram (16)
  • business model explained (15)
  • data analysis (15)

Categories

  • Analysis
  • Business
  • Demographics
  • Economy
  • Finance
  • Framework
  • Functional
  • HR
  • Industry Examples
  • IT
  • Leadership
  • Lean
  • Lean Six Sigma
  • Marketing
  • Professional Development
  • Project Management
  • Risk Management
  • Social Media
  • Strategy
  • Top
  • Twitter
Copyright © 2025 Economy GDP. All Rights Reserved.
Theme: Catch Box by Catch Themes
Scroll Up