
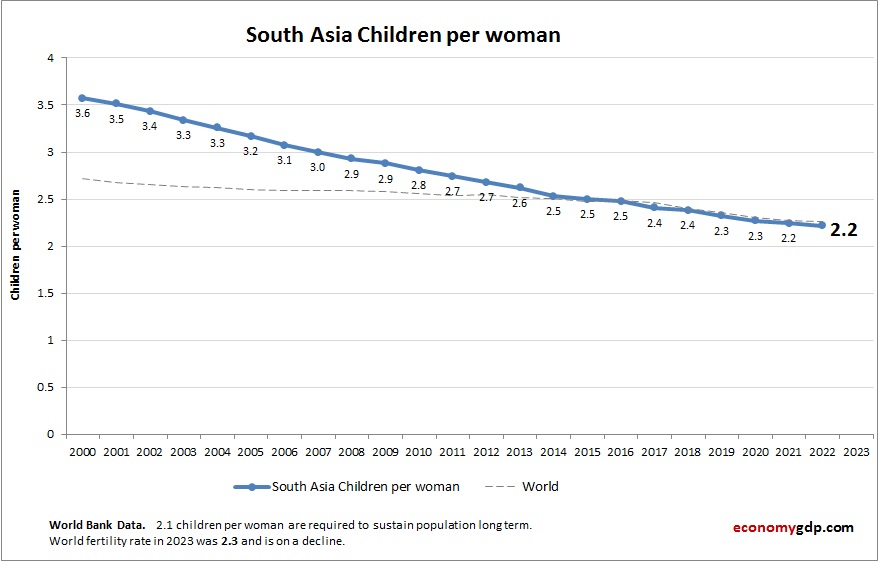
The above graph shows South Asia Children Per woman. This is according to World Bank birth stats by country. Latest births per woman information for South Asia.
South Asia has experienced a sharp fertility decline over recent decades. Economic development, increased female education, and government-led family planning have played central roles in this shift.
South Asia Children Per woman (Fertility Rate) Statistics by Year
| Year | Children per woman (fertility rate) |
| 2000 | 3.33 |
| 2001 | 3.28 |
| 2002 | 3.20 |
| 2003 | 3.10 |
| 2004 | 3.03 |
| 2005 | 2.94 |
| 2006 | 2.85 |
| 2007 | 2.76 |
| 2008 | 2.69 |
| 2009 | 2.64 |
| 2010 | 2.57 |
| 2011 | 2.50 |
| 2012 | 2.44 |
| 2013 | 2.38 |
| 2014 | 2.28 |
| 2015 | 2.28 |
| 2016 | 2.27 |
| 2017 | 2.19 |
| 2018 | 2.18 |
| 2019 | 2.12 |
| 2020 | 2.06 |
| 2021 | 2.03 |
| 2022 | 2.01 |
| 2023 | 2.0 |
| 2024 | 1.98 |
| 2025 (Est.) | 1.97 |
| 2026 (Est.) | 1.95 |