
Belarus PPP GDP reached $217.2 billion in 2023. Manufacturing, agriculture, and energy exports drive the economy, with GDP per capita (PPP) at $23,400. Sanctions and political isolation strain growth, though Russian trade ties provide support. High inflation and state-controlled industries limit diversification efforts. See all Belarus economy graphs.
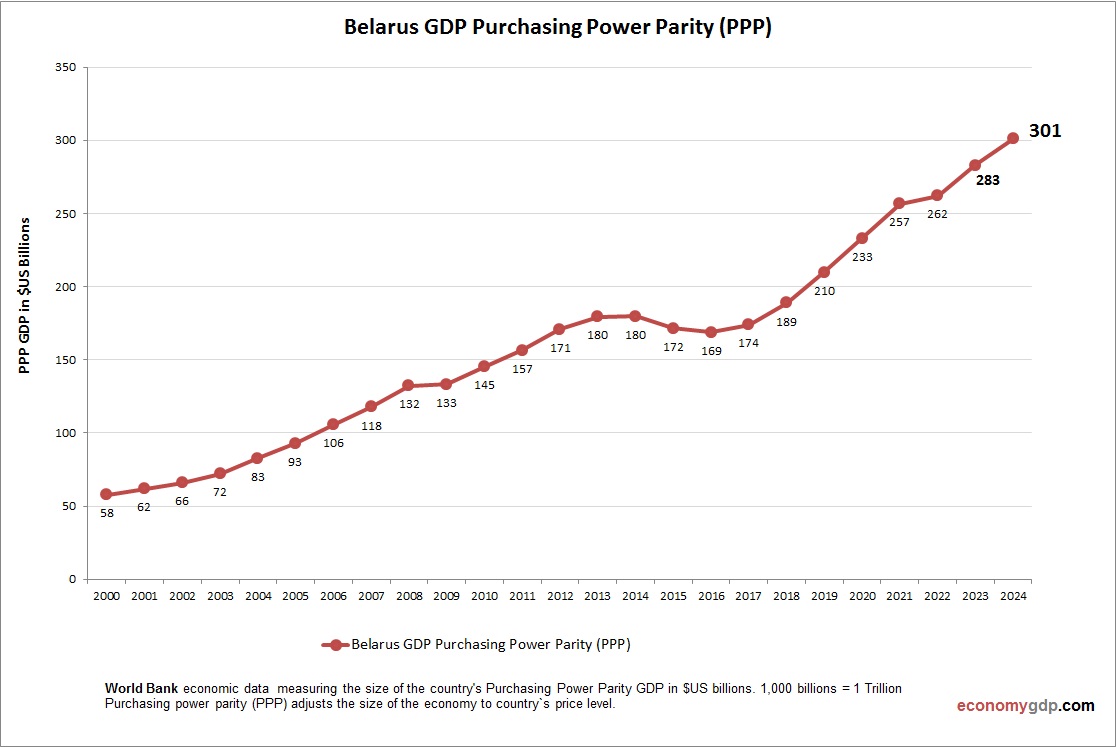
Belarus GDP PPP Statistics by Year
| Year | GDP, Purchasing Power Parity (PPP) |
| 2000 | 57.8 |
| 2001 | 61.9 |
| 2002 | 66.1 |
| 2003 | 72.1 |
| 2004 | 82.5 |
| 2005 | 93.1 |
| 2006 | 105.6 |
| 2007 | 117.8 |
| 2008 | 132.3 |
| 2009 | 133.4 |
| 2010 | 145.5 |
| 2011 | 156.7 |
| 2012 | 171.1 |
| 2013 | 179.6 |
| 2014 | 179.9 |
| 2015 | 171.6 |
| 2016 | 168.9 |
| 2017 | 174.2 |
| 2018 | 189.0 |
| 2019 | 210.1 |
| 2020 | 233.3 |
| 2021 | 256.9 |
| 2022 | 262.3 |
| 2023 | 283.0 |
| 2024 | 301.5 |
| 2025 (Est.) | 315.0 |
| 2026 (Est.) | 330.0 |