
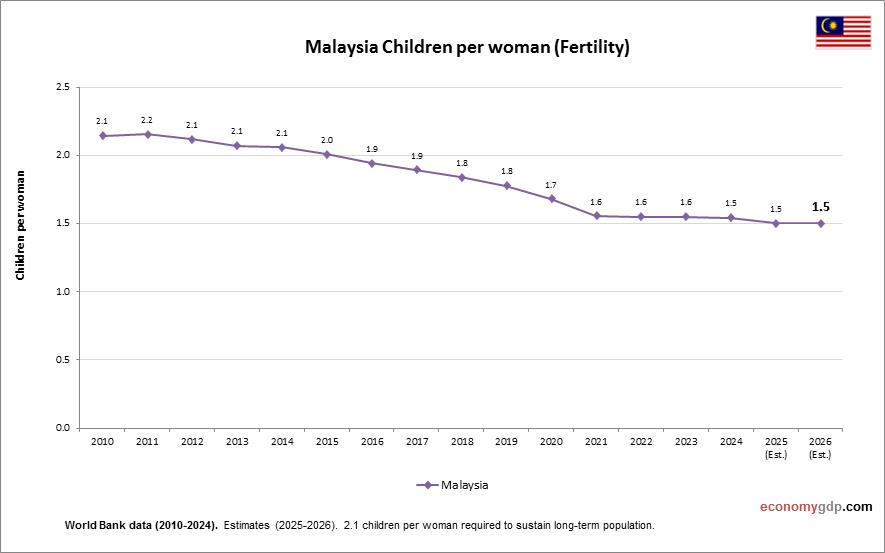
Chart above demonstrates Malaysia Children Per woman. The fertility rate statistics are compiled by World Bank. Based on the latest demographics info provided for Malaysia.
Malaysia has seen a steady decline in fertility rates, with women averaging about two children, reflecting increased urbanization, education, and access to reproductive health services.
Malaysia Children Per woman (Fertility Rate) Statistics by Year
| Year | Children per woman (fertility rate) |
| 2000 | 2.94 |
| 2001 | 2.81 |
| 2002 | 2.66 |
| 2003 | 2.60 |
| 2004 | 2.49 |
| 2005 | 2.39 |
| 2006 | 2.31 |
| 2007 | 2.25 |
| 2008 | 2.26 |
| 2009 | 2.22 |
| 2010 | 2.14 |
| 2011 | 2.15 |
| 2012 | 2.12 |
| 2013 | 2.07 |
| 2014 | 2.06 |
| 2015 | 2.01 |
| 2016 | 1.94 |
| 2017 | 1.89 |
| 2018 | 1.84 |
| 2019 | 1.78 |
| 2020 | 1.68 |
| 2021 | 1.56 |
| 2022 | 1.55 |
| 2023 | 1.55 |
| 2024 | 1.54 |
| 2025 (Est.) | 1.50 |
| 2026 (Est.) | 1.50 |