British East India Company 1600: Trade and Empire
In 1600, Queen Elizabeth I chartered the British East India Company, controlling trade in India and establishing economic dominance.

World economy charts, business frameworks and diagrams
In 1600, Queen Elizabeth I chartered the British East India Company, controlling trade in India and establishing economic dominance.

This chart demonstrates Azerbaijan GDP per capita. The economic data is provided by World Bank. Based on the latest available information for Azerbaijan. Azerbaijan’s GDP per capita has seen growth, largely due to its oil and gas exports. Efforts to View diagram Azerbaijan GDP per capita

Maldives' economy is tourism-led, with luxury resorts. Fisheries export tuna. Male's services grow. Challenges include climate rise. Efforts target diversification. Maldives' Indian Ocean atolls boost eco-tourism. High income vulnerable to pandemics. World Bank Data. 2000-2024. Last updated Oct 2025. Refer View diagram Maldives Economy

This graph shows South Korea GDP per capita. The economic data is provided by World Bank. Latest GDP per person information for South Korea. South Korea’s GDP per capita in 2024 is estimated at approximately $37,000. South Korea has one View diagram South Korea GDP per capita
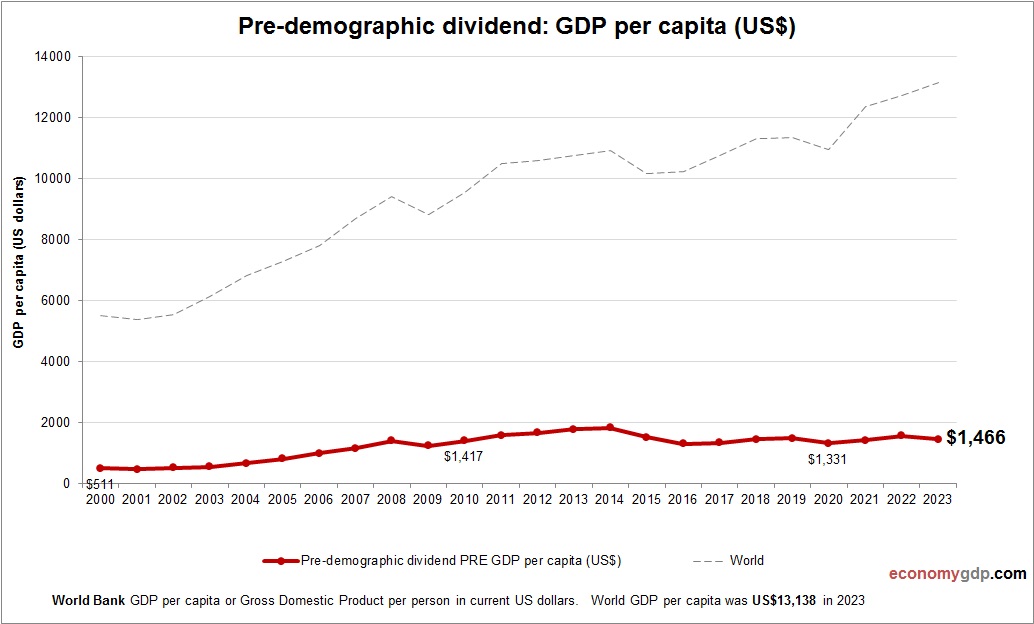
This diagram presents Pre-demographic dividend GDP per capita. The gross domestic product statistics are compiled by World Bank. Based on the latest economic info provided for Pre-demographic dividend.
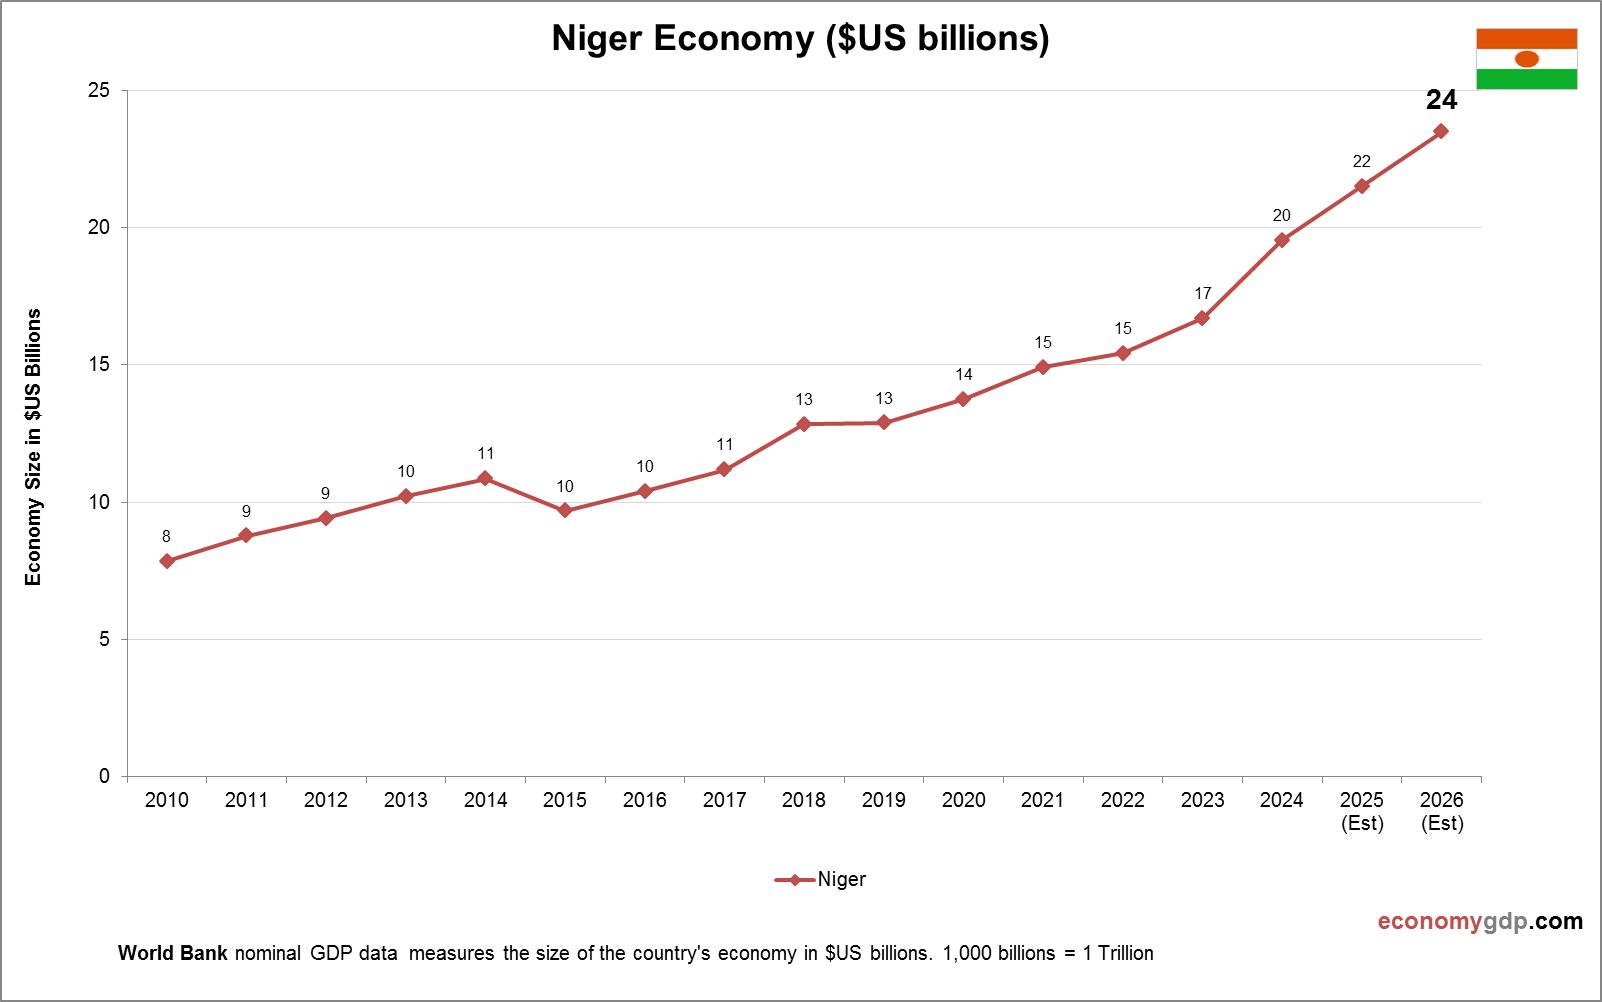
Niger’s economy, valued at $15 billion, is dominated by subsistence agriculture, employing 80% of the workforce, with millet, sorghum, and livestock as staples. Uranium mining is a critical export, though declining in global demand. Oil production, started in 2011, is View diagram Niger Economy in Graphs
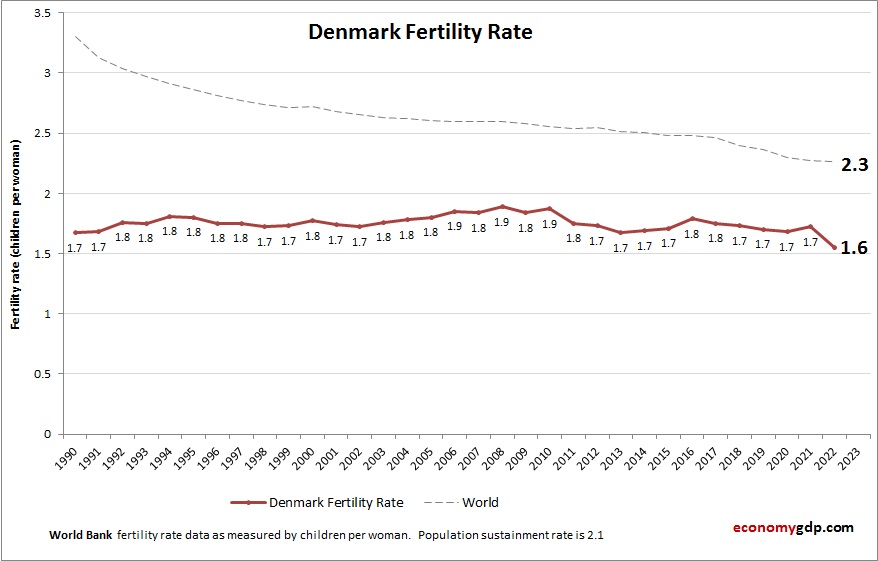
Chart above demonstrates Denmark Fertility Rate. World Bank is the source of this birth data. Latest births per woman information for Denmark. Denmarks fertility rate is low, slightly below replacement level. Despite generous family support policies, social trends such as View diagram Denmark Fertility Rate
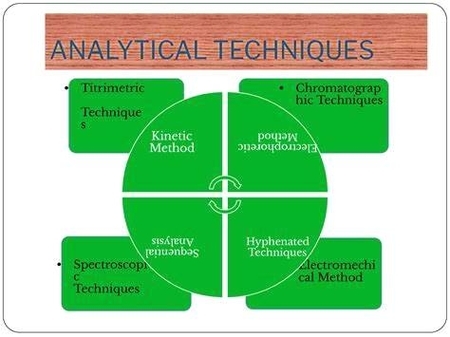
Data Analysis Sample Illustrated: A data analysis sample illustrated visually represents how raw data can be processed, analyzed, and interpreted to extract meaningful insights. This often includes charts, graphs, and tables that show trends, patterns, or correlations in the data. View diagram Data Analysis Sample Illustrated
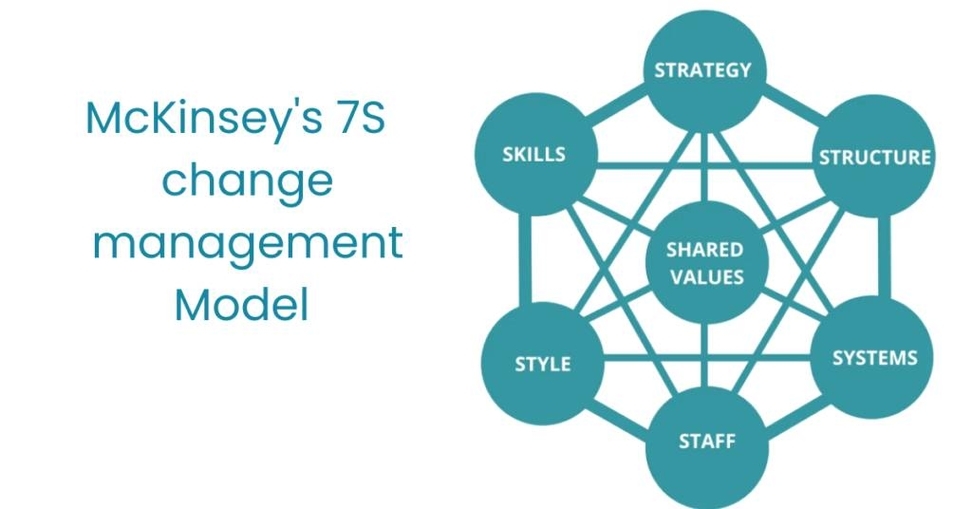
IT Change Management Process: The IT change management process involves planning, implementing, and monitoring changes to an organization’s IT infrastructure in a controlled manner to minimize risk. This process ensures that changes, such as software updates or system upgrades, are View diagram IT Change Management Process

Sweden’s economy excels in technology, manufacturing, and services. Companies like Ericsson and Spotify lead in telecom and digital innovation, while Volvo drives automotive manufacturing. Forestry and paper products are significant. Emerging industries include green technology, with electric vehicle batteries and View diagram Sweden Economy in Graphs