
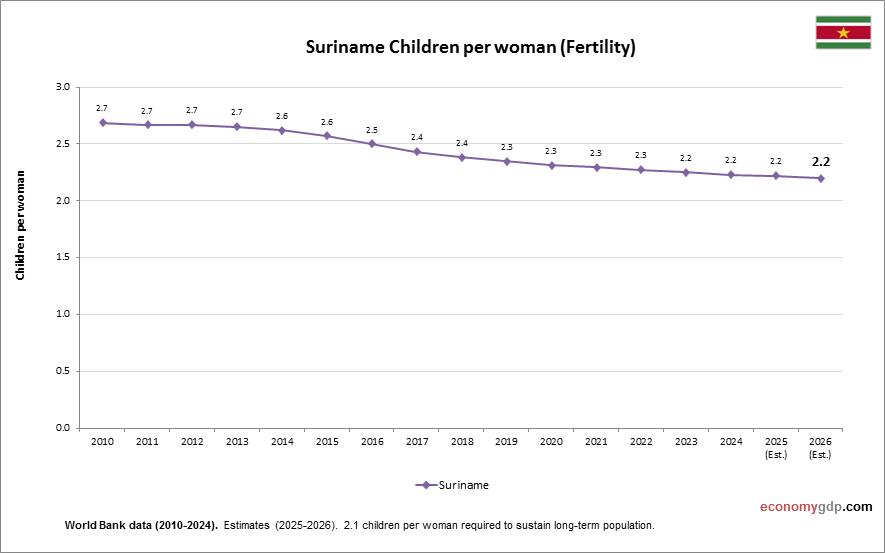
The above graph shows Suriname Children Per woman. World Bank is the source of this birth data. Latest births per woman information for Suriname.
Surinames children per woman rate is moderate. Urbanization and access to reproductive healthcare are contributing to smaller family sizes over time.
Suriname Children Per woman (Fertility Rate) Statistics by Year
| Year | Children per woman (fertility rate) |
| 2000 | 3.05 |
| 2001 | 3.06 |
| 2002 | 2.96 |
| 2003 | 2.84 |
| 2004 | 2.74 |
| 2005 | 2.71 |
| 2006 | 2.73 |
| 2007 | 2.74 |
| 2008 | 2.73 |
| 2009 | 2.71 |
| 2010 | 2.69 |
| 2011 | 2.67 |
| 2012 | 2.67 |
| 2013 | 2.65 |
| 2014 | 2.62 |
| 2015 | 2.57 |
| 2016 | 2.50 |
| 2017 | 2.43 |
| 2018 | 2.38 |
| 2019 | 2.35 |
| 2020 | 2.31 |
| 2021 | 2.30 |
| 2022 | 2.27 |
| 2023 | 2.25 |
| 2024 | 2.23 |
| 2025 (Est.) | 2.22 |
| 2026 (Est.) | 2.20 |