
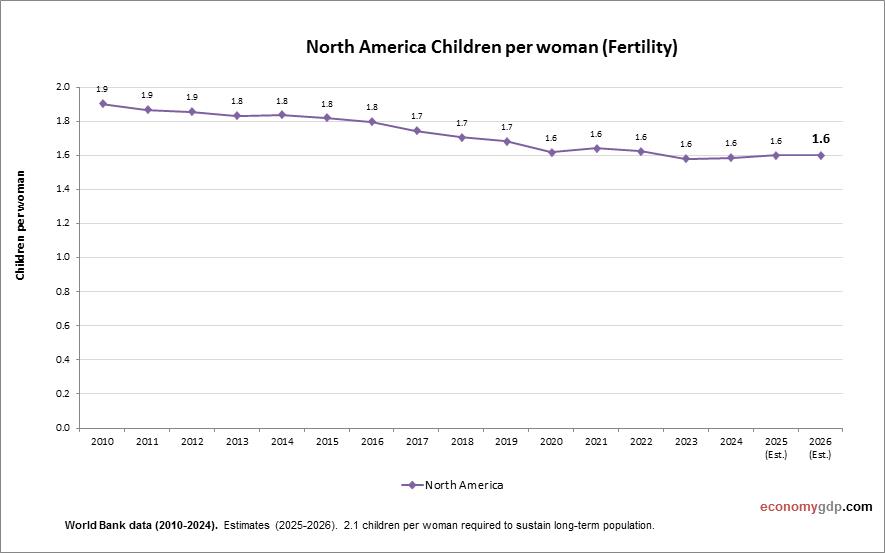
This diagram presents North America Children Per woman. This is according to World Bank birth stats by country. Based on the latest demographics info provided for North America.
North America has a low children per woman rate overall, particularly in the U.S. and Canada. Delayed childbearing, economic factors, and shifting societal expectations are major influences.
North America Children Per woman (Fertility Rate) Statistics by Year
| Year | Children per woman (fertility rate) |
| 2000 | 2.0 |
| 2001 | 1.98 |
| 2002 | 1.97 |
| 2003 | 2.0 |
| 2004 | 2.0 |
| 2005 | 2.01 |
| 2006 | 2.06 |
| 2007 | 2.07 |
| 2008 | 2.03 |
| 2009 | 1.97 |
| 2010 | 1.90 |
| 2011 | 1.87 |
| 2012 | 1.85 |
| 2013 | 1.83 |
| 2014 | 1.84 |
| 2015 | 1.82 |
| 2016 | 1.80 |
| 2017 | 1.74 |
| 2018 | 1.71 |
| 2019 | 1.68 |
| 2020 | 1.62 |
| 2021 | 1.64 |
| 2022 | 1.62 |
| 2023 | 1.58 |
| 2024 | 1.59 |
| 2025 (Est.) | 1.60 |
| 2026 (Est.) | 1.60 |