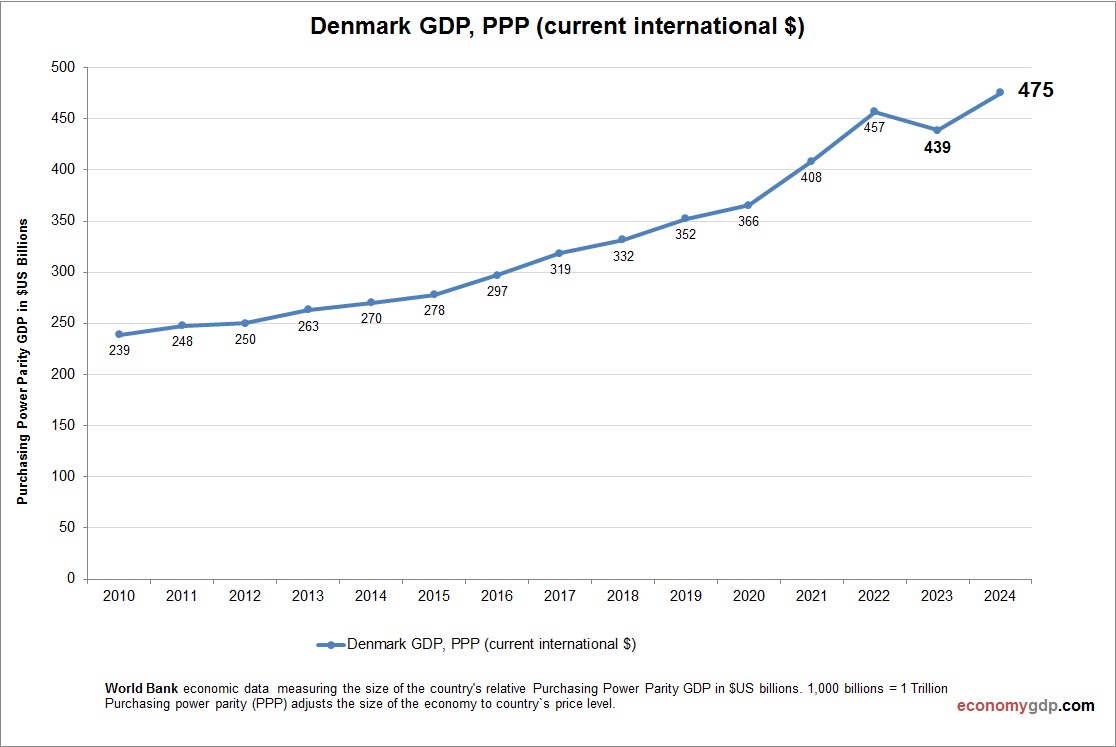
Skip to content
cropped-economygdp.jpg

Economy GDP

World economy charts, business frameworks and diagrams

Menu

Primary menu

  • Economy
    • Top Economies
  • Demographics
  • Business
    • Strategy
    • Project Management
    • Industry Examples
    • Leadership
    • HR
    • Industry Examples
  • Framework
  • Analysis
  • Lean Six Sigma
    • Lean
  • IT
    • Social Media
  • Marketing
  • Stories
  • Top

Tag Archives: Denmark statistics

Denmark GDP PPP

Denmark GDP PPP

Denmark’s PPP GDP was $435.7 billion in 2023. Advanced manufacturing, services, and renewable energy drive the economy, with GDP per capita (PPP) at $74,000. High welfare spending and innovation support growth, though global trade risks and aging populations challenge sustainability. View diagram Denmark GDP PPP→

Posted in Economy | Tagged Denmark, Denmark economy, Denmark gdp, Denmark statistics

Denmark Children Per woman

Denmark Children Per woman

The above graph shows Denmark Children Per woman. World Bank is the source of this birth data. Based on the latest available information for Denmark. Denmark has a low children per woman rate. Economic stability and comprehensive parental support exist, View diagram Denmark Children Per woman→

Posted in Demographics | Tagged Denmark demographics, Denmark statistics

Denmark Fertility Rate

Denmark Fertility Rate

Chart above demonstrates Denmark Fertility Rate. World Bank is the source of this birth data. Latest births per woman information for Denmark. Denmark’s fertility rate is low, slightly below replacement level. Despite generous family support policies, social trends such as View diagram Denmark Fertility Rate→

Posted in Demographics | Tagged Denmark demographics, Denmark statistics

Denmark GDP Purchasing Power Parity

Denmark GDP Purchasing Power Parity

Denmark’s GDP (PPP) is projected at $436.2 billion in 2025. Denmark’s economy is driven by services, manufacturing, and renewable energy, with strong pharmaceutical and shipping sectors. The PPP adjustment moderates GDP due to a high cost of living. A robust View diagram Denmark GDP Purchasing Power Parity→

Posted in Economy | Tagged Denmark, Denmark economy, Denmark gdp, Denmark statistics

Primary Sidebar Widget Area

Top Diagrams

Latest Posts

  • Ecuador Inflation
  • Porter Diamond Model Strategy
  • Liberia GDP
  • Customer Experience Management Model
  • Paraguay Economy
  • Arab World GDP per capita
  • Israel Children Per woman
  • Japan Inflation
  • Puerto Rico Fertility Rate
  • Barbados GDP
  • Ancient Egypt Grain Banks: First Paper Money System
  • Kiribati GDP
  • Equatorial Guinea Inflation
  • Soviet Union Planned Economy Rise and Fall
  • Tuvalu Children Per woman
  • Twitter
Copyright © 2026 Economy GDP. All Rights Reserved.
Theme: Catch Box by Catch Themes
Scroll Up