Peru Economy in Graphs

Peru Economy in Graphs

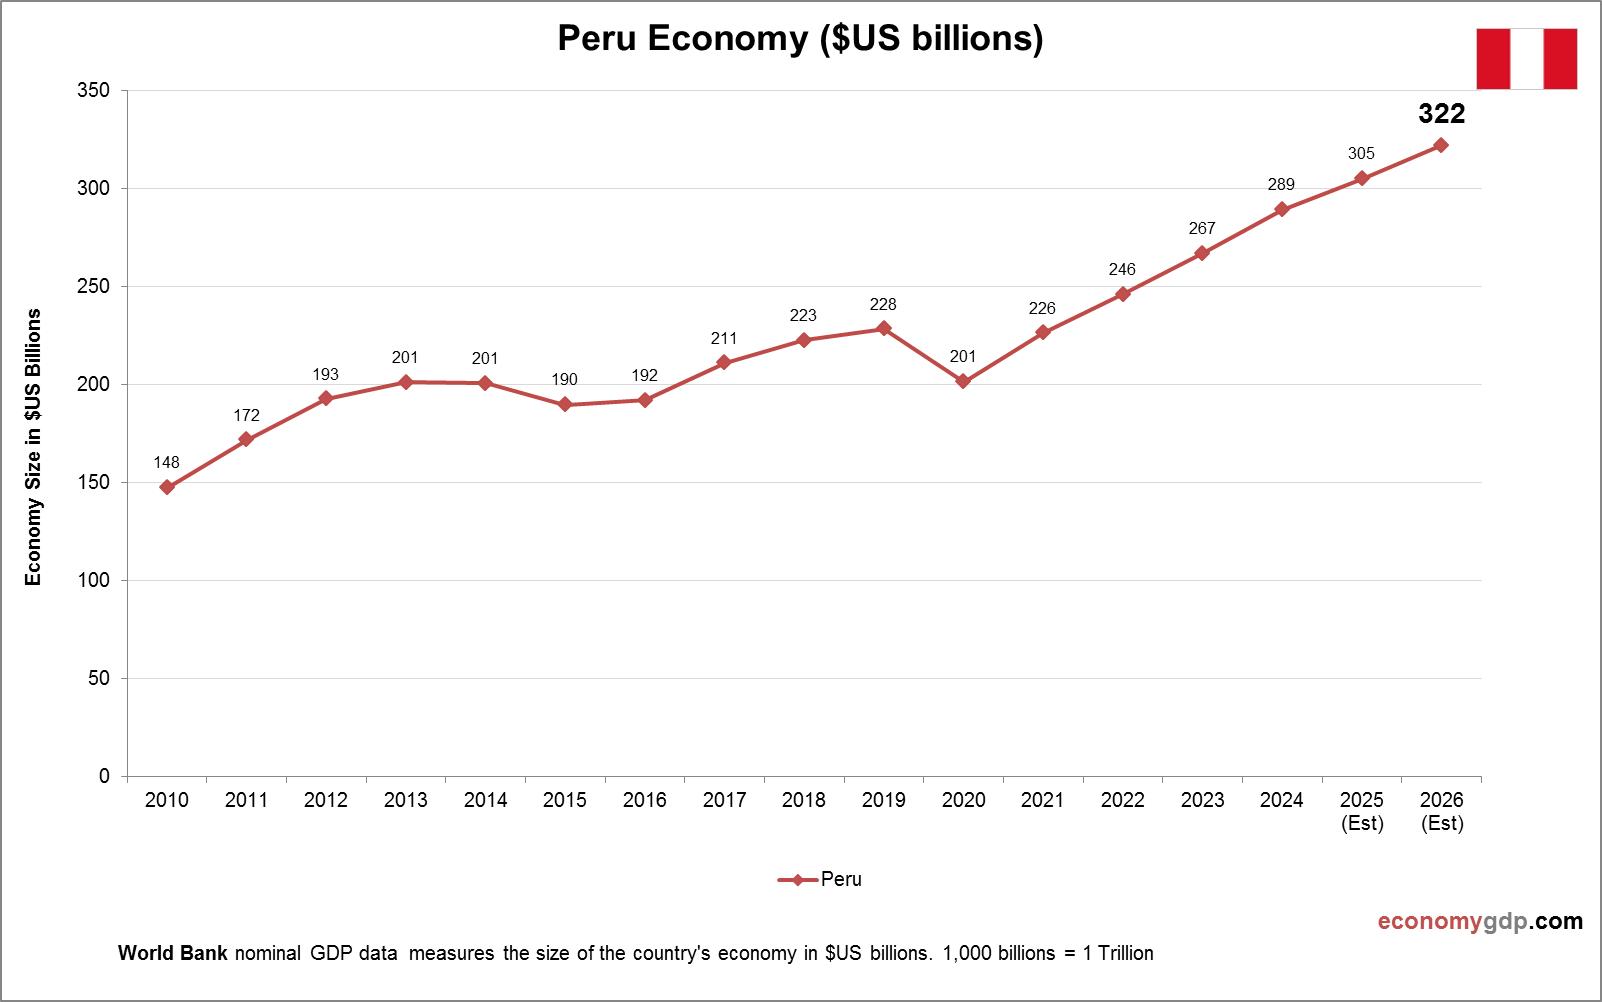
Peru’s economy, valued at $225 billion, is driven by mining, which supplies 60% of exports, including copper, gold, and zinc. Agriculture, producing asparagus and blueberries, employs 25% of the workforce. Fisheries, particularly anchovy for fishmeal, are key. Tourism, centered on View diagram Peru Economy in Graphs

Morocco Economy in Graphs

Morocco Economy in Graphs

The Morocco economy is diverse, driven by agriculture, tourism, and manufacturing. Phosphates, citrus, and textiles are key exports, while tourism, including Marrakech and coastal resorts, thrives. Renewable energy, particularly solar, is a growing sector, with ambitious green projects attracting investment. View diagram Morocco Economy in Graphs

Mongolia Economy in Graphs

Mongolia Economy in Graphs

The Mongolia economy is driven by mining, particularly coal, copper, and gold. Livestock and cashmere also contribute, supporting rural livelihoods. Chinese demand for minerals fuels growth, but overreliance on commodities and weak infrastructure pose risks. Harsh winters and environmental degradation View diagram Mongolia Economy in Graphs

Mali Economy in Graphs

Mali Economy in Graphs

The Mali economy relies on agriculture, gold, and cotton. Gold is a major export, while subsistence farming employs most of the population. Political instability, conflict, and drought disrupt growth, with poverty widespread. Foreign aid and mining investment provide support, but View diagram Mali Economy in Graphs