Malaysia Economy in Graphs
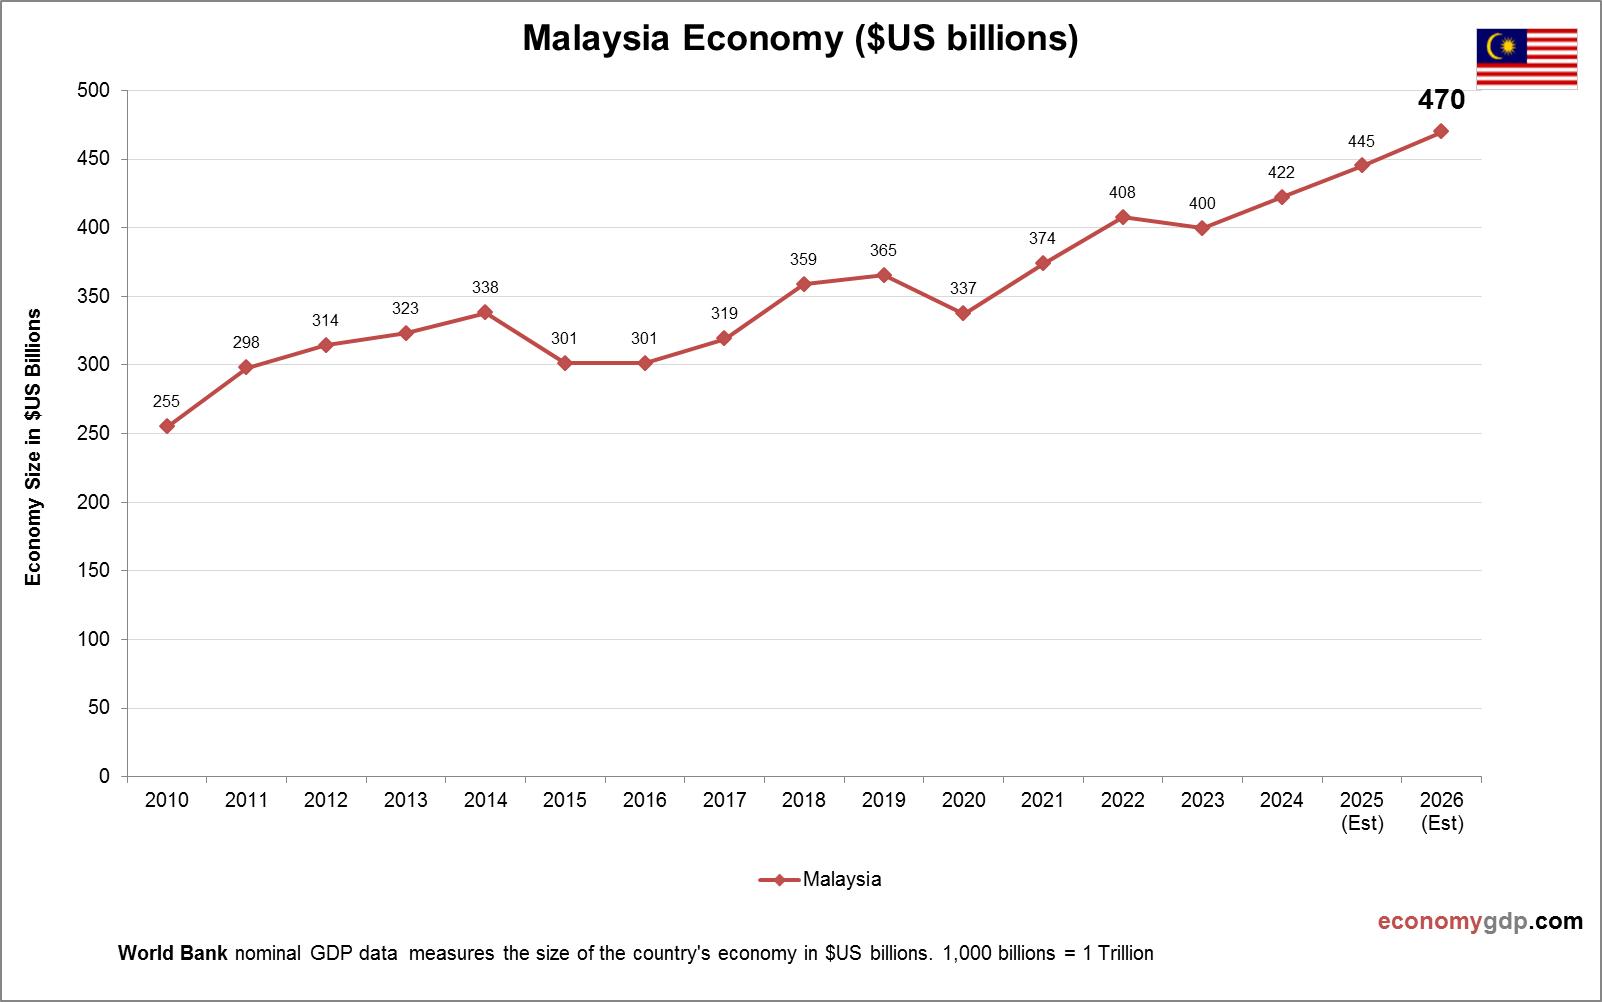
The Malaysia economy is diverse, driven by manufacturing, palm oil, and services. Electronics and petrochemicals dominate exports, while tourism and Islamic finance are growing. Strong infrastructure and foreign investment support growth, but inequality and reliance on commodities pose risks. Efforts View diagram Malaysia Economy in Graphs