Skip to content
cropped-economygdp.jpg

Economy GDP

World economy charts, business frameworks and diagrams

Menu

Primary menu

  • Economy
    • Top Economies
  • Demographics
  • Business
    • Strategy
    • Project Management
    • Industry Examples
    • Leadership
    • HR
    • Industry Examples
  • Framework
  • Analysis
  • Lean Six Sigma
    • Lean
  • IT
    • Social Media
  • Marketing
  • Stories
  • Top

Tag Archives: South Africa statistics

South Africa Children Per woman

South Africa Children Per woman

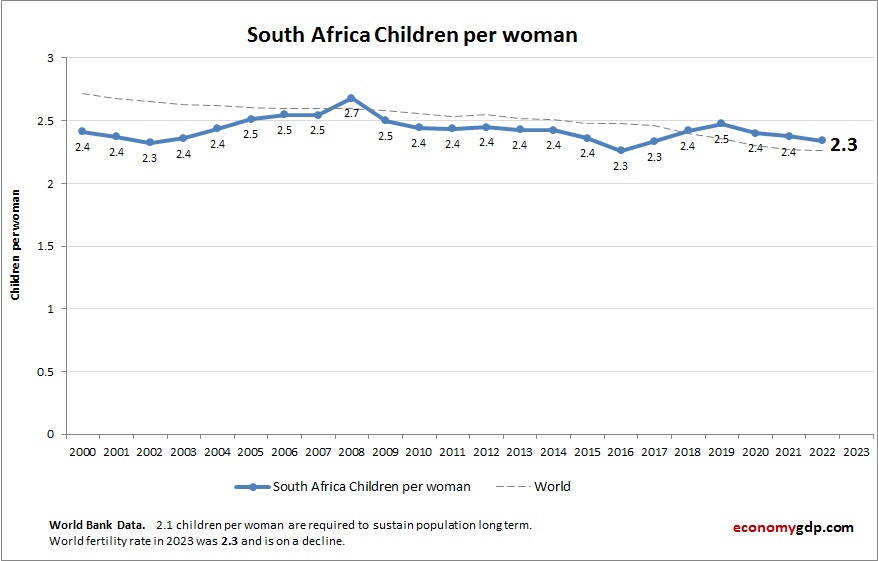
This diagram presents South Africa Children Per woman. World Bank is the source of this birth data. Latest births per woman information for South Africa. South Africa has a moderate children per woman rate. Urbanization, education, and access to health View diagram South Africa Children Per woman→

Posted in Demographics | Tagged South Africa demographics, South Africa statistics

South Africa Inflation

South Africa Inflation

This diagram presents South Africa Inflation. Inflation data is sourced from World Bank. Change in consumer prices for South Africa. South Africa’s inflation is driven by energy and food prices, currency depreciation, and public utility costs. Structural challenges like unemployment View diagram South Africa Inflation→

Posted in Economy | Tagged South Africa economy, South Africa statistics

South Africa GDP per capita

South Africa GDP per capita

This graph shows South Africa GDP per capita. The gross domestic product statistics are compiled by World Bank. Based on the latest economic info provided for South Africa. South Africa’s GDP per capita in 2024 is projected at around $7,500. View diagram South Africa GDP per capita→

Posted in Economy | Tagged South Africa economy, South Africa statistics

South Africa Fertility Rate

South Africa Fertility Rate

Chart above demonstrates South Africa Fertility Rate. The fertility rate statistics are compiled by World Bank. Based on the latest available information for South Africa. South Africa’s fertility rate is moderate and declining. Urban living and education access have reduced View diagram South Africa Fertility Rate→

Posted in Demographics | Tagged South Africa demographics, South Africa statistics

South Africa GDP Purchasing Power Parity

South Africa GDP Purchasing Power Parity

South Africa economy graph showing purchasing power parity (PPP) growth from 2000 to today. Purchasing power parity adjusts the size of the economy to relevant price levels, i.e. measuring the price of specific goods in different countries and adjusting GDP View diagram South Africa GDP Purchasing Power Parity→

Posted in Economy | Tagged South Africa, South Africa economy, South Africa gdp, South Africa statistics

Primary Sidebar Widget Area

Top Diagrams

Latest Posts

  • North Korea Economy in Graphs
  • New Zealand Economy in Graphs
  • Mozambique Economy in Graphs
  • Morocco Economy in Graphs
  • Mongolia Economy in Graphs
  • Mali Economy in Graphs
  • Malaysia Economy in Graphs
  • Luxembourg Economy in Graphs
  • Lithuania Economy in Graphs
  • Libya Economy in Graphs
  • Liberia Economy in Graphs
  • Kyrgyzstan Economy in Graphs
  • Kuwait Economy in Graphs
  • Jordan Economy in Graphs
  • Iraq Economy in Graphs
  • Twitter
Copyright © 2026 Economy GDP. All Rights Reserved.
Theme: Catch Box by Catch Themes
Scroll Up