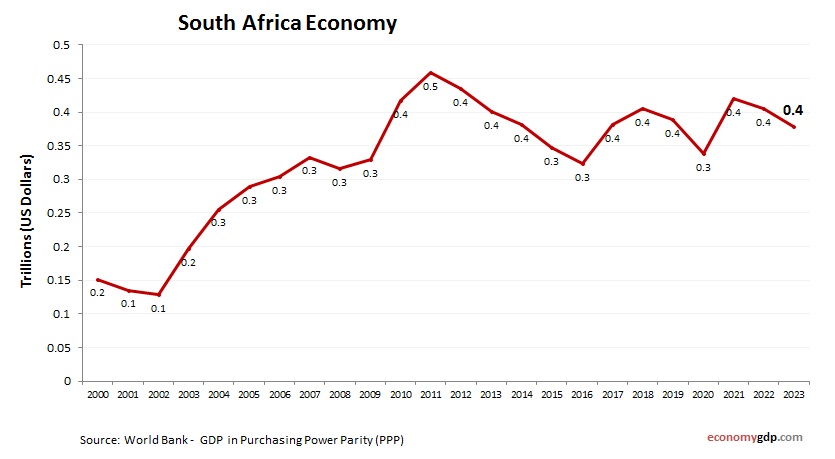
Tag Archives: South Africa gdp
South Africa GDP PPP

South Africa economy graph showing purchasing power parity (PPP) growth from 1990 to today. Purchasing power parity adjusts the size of the economy to relevant price levels, i.e. measuring the price of specific goods in different countries and adjusting GDP View diagram South Africa GDP PPP
South Africa Economy

South Africa economy growth from 2000 to today. GDP (current US$). World Bank and OECD national accounts data. South Africas economy is the most industrialized in Africa, classified as upper-middle-income. It is rich in minerals and has a strong services View diagram South Africa Economy
South Africa GDP Purchasing Power Parity

South Africa economy graph showing purchasing power parity (PPP) growth from 2000 to today. Purchasing power parity adjusts the size of the economy to relevant price levels, i.e. measuring the price of specific goods in different countries and adjusting GDP View diagram South Africa GDP Purchasing Power Parity
South Africa GDP

South Africa GDP from 1990 to today. World Bank and OECD data. GDP in US dollars. South Africa is an upper-middle-income economy with GDP driven by mining, finance, and services. Structural issues like inequality and unemployment challenge growth, but reforms View diagram South Africa GDP