
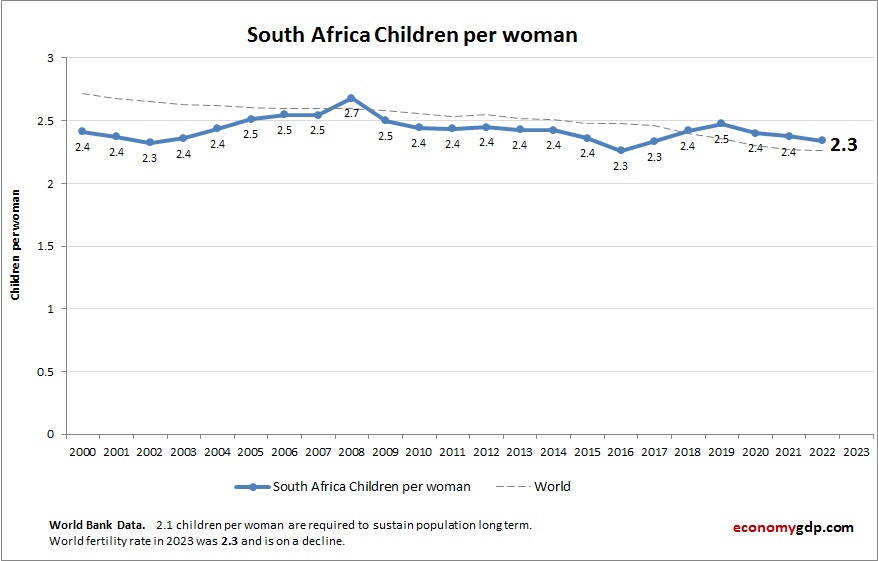
This diagram presents South Africa Children Per woman. World Bank is the source of this birth data. Latest births per woman information for South Africa.
South Africa has a moderate children per woman rate. Urbanization, education, and access to health services have steadily reduced fertility.
South Africa Children Per woman (Fertility Rate) Statistics by Year
| Year | Children per woman (fertility rate) |
| 2000 | 2.41 |
| 2001 | 2.37 |
| 2002 | 2.32 |
| 2003 | 2.36 |
| 2004 | 2.44 |
| 2005 | 2.51 |
| 2006 | 2.55 |
| 2007 | 2.55 |
| 2008 | 2.68 |
| 2009 | 2.50 |
| 2010 | 2.45 |
| 2011 | 2.44 |
| 2012 | 2.45 |
| 2013 | 2.43 |
| 2014 | 2.42 |
| 2015 | 2.36 |
| 2016 | 2.26 |
| 2017 | 2.28 |
| 2018 | 2.27 |
| 2019 | 2.26 |
| 2020 | 2.26 |
| 2021 | 2.25 |
| 2022 | 2.23 |
| 2023 | 2.22 |
| 2024 | 2.21 |
| 2025 (Est.) | 2.19 |
| 2026 (Est.) | 2.18 |