Palestine GDP PPP

Palestine GDP PPP

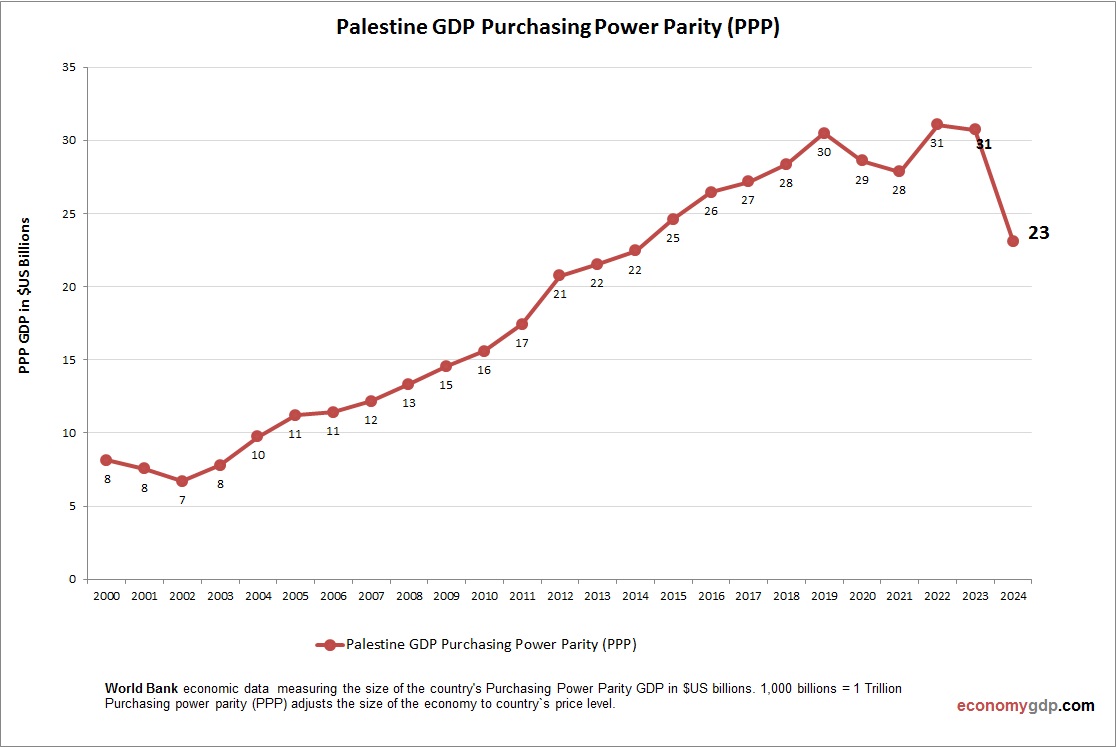
Palestine’s PPP GDP was $36.6 billion in 2023. Services and aid drive the economy, with GDP per capita (PPP) at $7,100. Conflict and restrictions limit growth, with high unemployment. International support and private sector development are critical for economic progress.[](https://en.wikipedia.org/wiki/List_of_countries_by_GDP_%28PPP%29) View diagram Palestine GDP PPP→

Bolivia Economy in Graphs

The Bolivia economy is driven by natural gas, mining, and agriculture. Hydrocarbons and minerals like lithium and silver are key exports, while coca and quinoa support rural livelihoods. Nationalization policies have increased state control over resources, but economic diversification remains View diagram Bolivia Economy in Graphs→

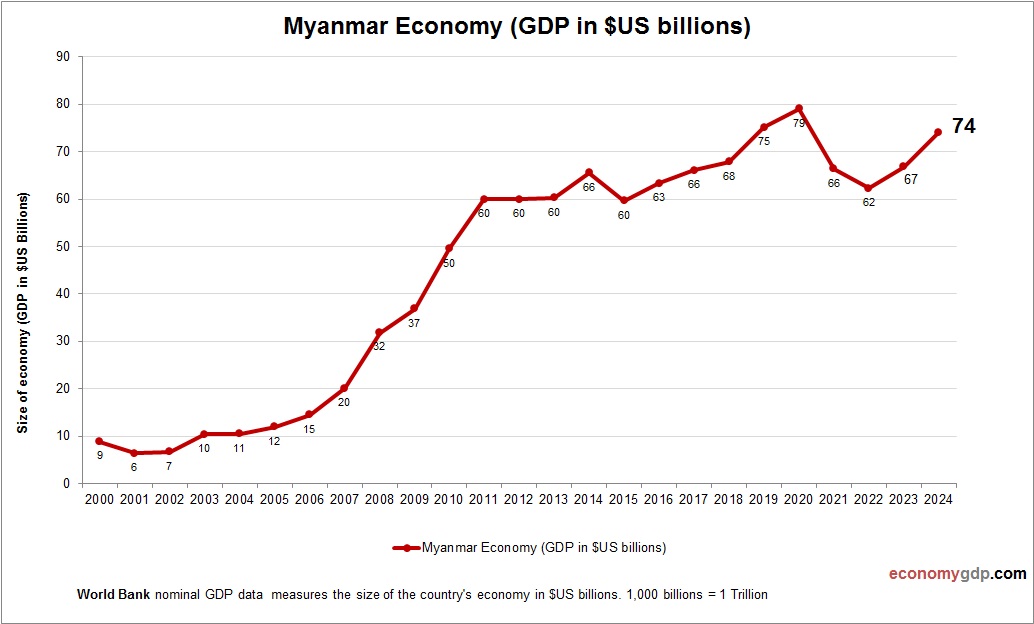
Myanmar Economy

Myanmar Economy

Myanmar's economy features jade, gas, and teak exports. Agriculture includes rice. Tourism to pagodas recovers. Yangon's services grow. Challenges include sanctions. Efforts target garments. Myanmar's Southeast Asian position aids trade. Reforms promise potential amid conflicts. World Bank Data. 2000-2024. Last View diagram Myanmar Economy→

Customer Journey Map Example

Customer Journey Map Example

Customer Journey Map Example: A customer journey map example is a visual representation that outlines the different stages a customer goes through while interacting with a company. This example could detail the journey from initial awareness through to post-purchase and View diagram Customer Journey Map Example→

Albania GDP

Albania GDP

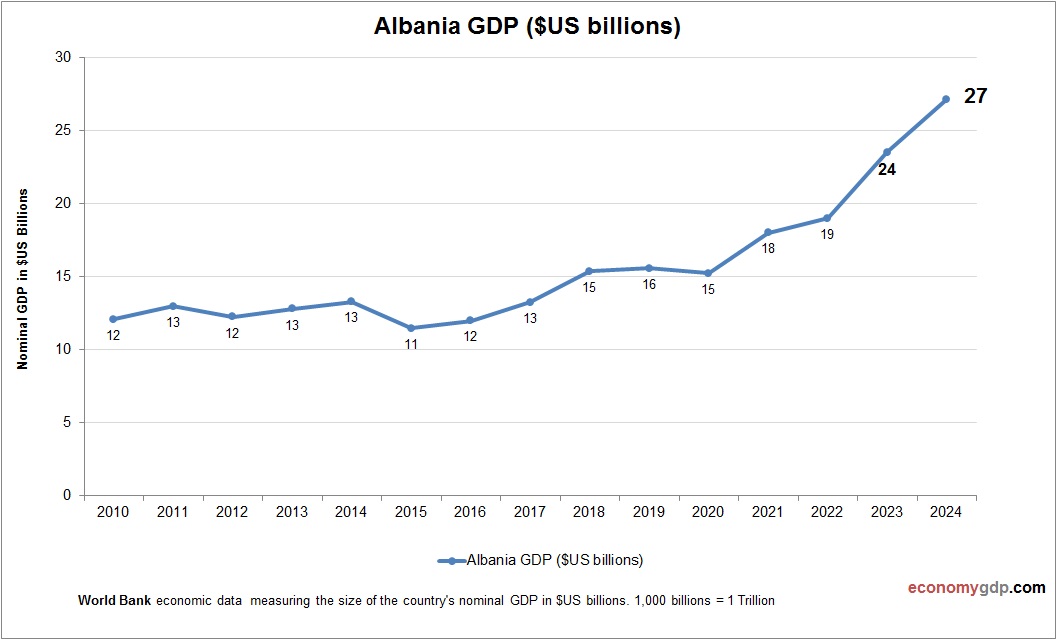
Albania's $26 billion economy, growing 3.4% in 2025, excels in tourism, energy, and remittances, with per capita at $9,000. Construction and services drive exports, but fuel imports challenge for 2.8 million people. Inequality and infrastructure gaps persist. Recent hydropower and View diagram Albania GDP→