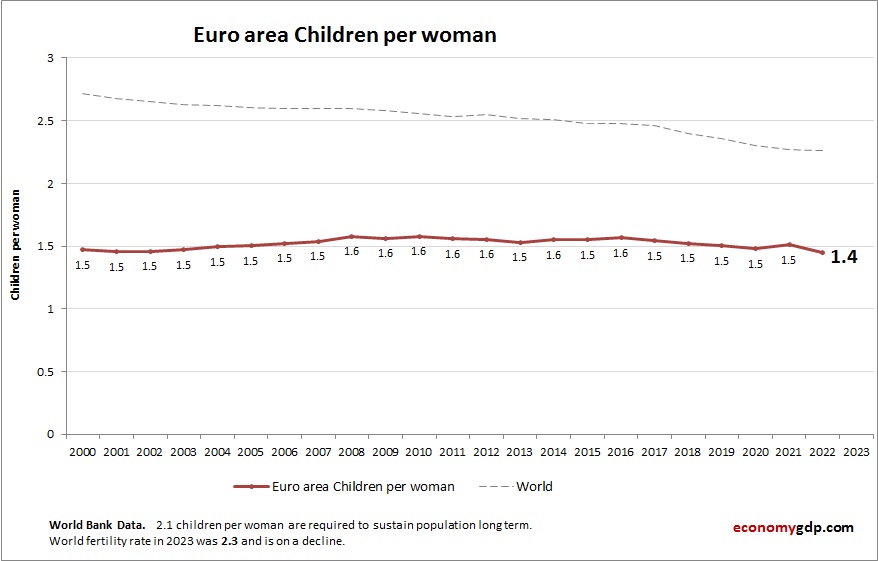
Euro area Fertility Rate
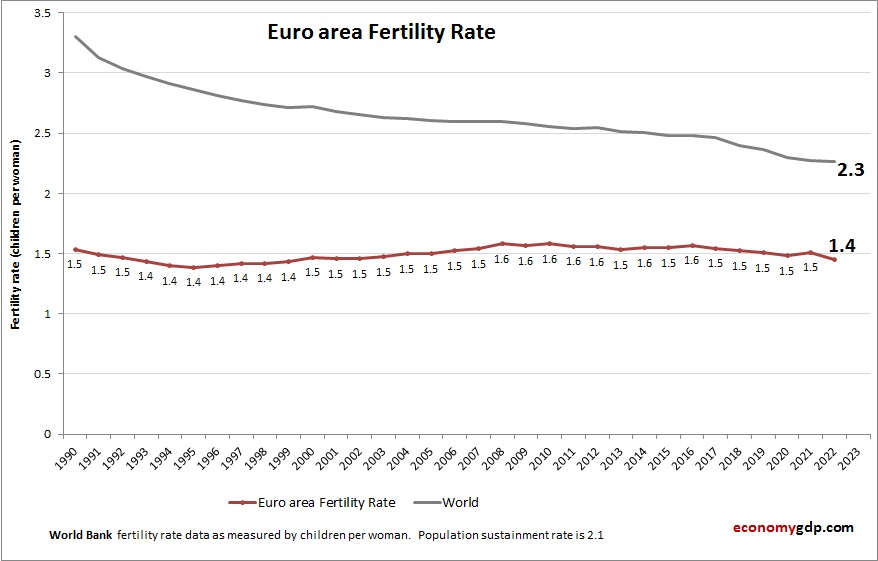
This diagram presents Euro area Fertility Rate. This is according to World Bank birth stats by country. Based on the latest available information for Euro area. The Euro area consistently shows low fertility rates. Economic pressures, aging populations, and lifestyle View diagram Euro area Fertility Rate