
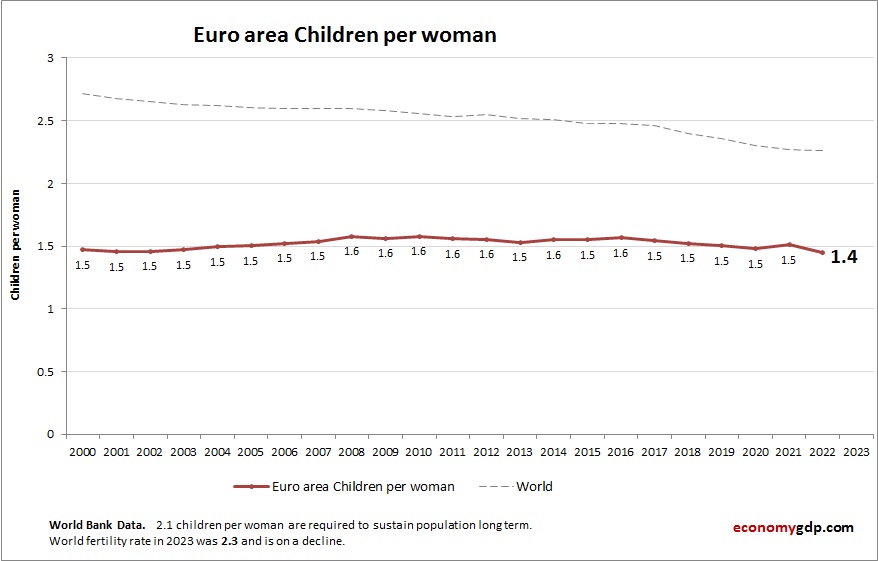
The above graph shows Euro area Children Per woman. World Bank is the source of this birth data. Latest births per woman information for Euro area.
The children per woman rate in the Euro area is very low. Delayed marriage, aging populations, and economic concerns continue to drive fertility well below replacement level.
Euro area Children Per woman (Fertility Rate) Statistics by Year
| Year | Children per woman (fertility rate) |
| 2000 | 1.47 |
| 2001 | 1.46 |
| 2002 | 1.46 |
| 2003 | 1.47 |
| 2004 | 1.50 |
| 2005 | 1.50 |
| 2006 | 1.52 |
| 2007 | 1.54 |
| 2008 | 1.58 |
| 2009 | 1.56 |
| 2010 | 1.58 |
| 2011 | 1.56 |
| 2012 | 1.55 |
| 2013 | 1.53 |
| 2014 | 1.55 |
| 2015 | 1.55 |
| 2016 | 1.57 |
| 2017 | 1.55 |
| 2018 | 1.53 |
| 2019 | 1.50 |
| 2020 | 1.48 |
| 2021 | 1.51 |
| 2022 | 1.44 |
| 2023 | 1.38 |
| 2024 | 1.35 |
| 2025 (Est.) | 1.30 |
| 2026 (Est.) | 1.30 |