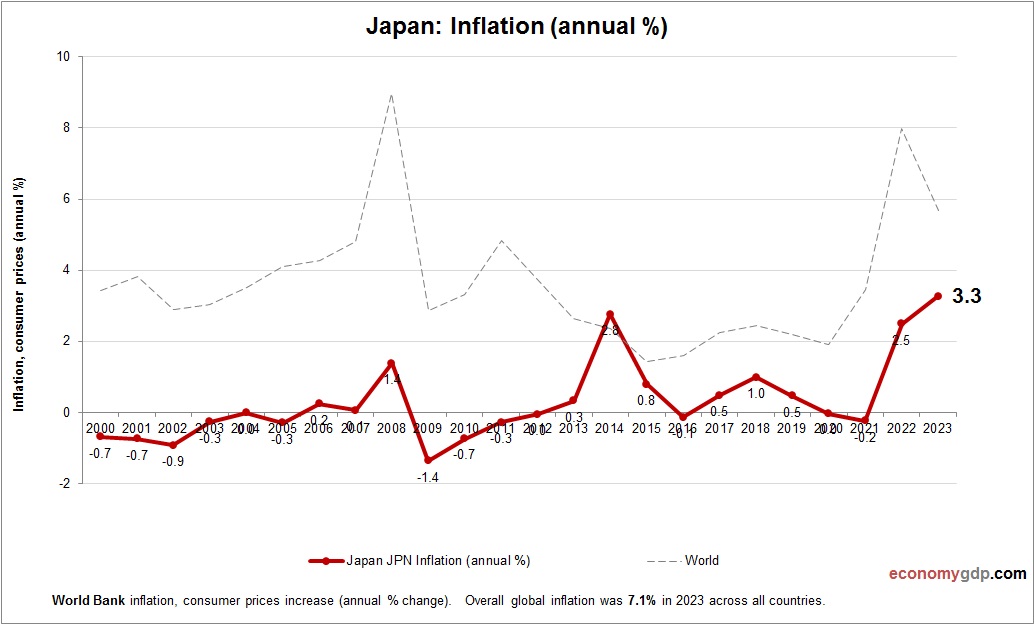
Japan Inflation

Japan Inflation

This graph shows Japan Inflation. The consumer price statistics are compiled by World Bank. Based on the latest economic data provided for Japan. Japan’s inflation has historically been low, but recent increases stem from rising energy import costs and yen View diagram Japan Inflation→

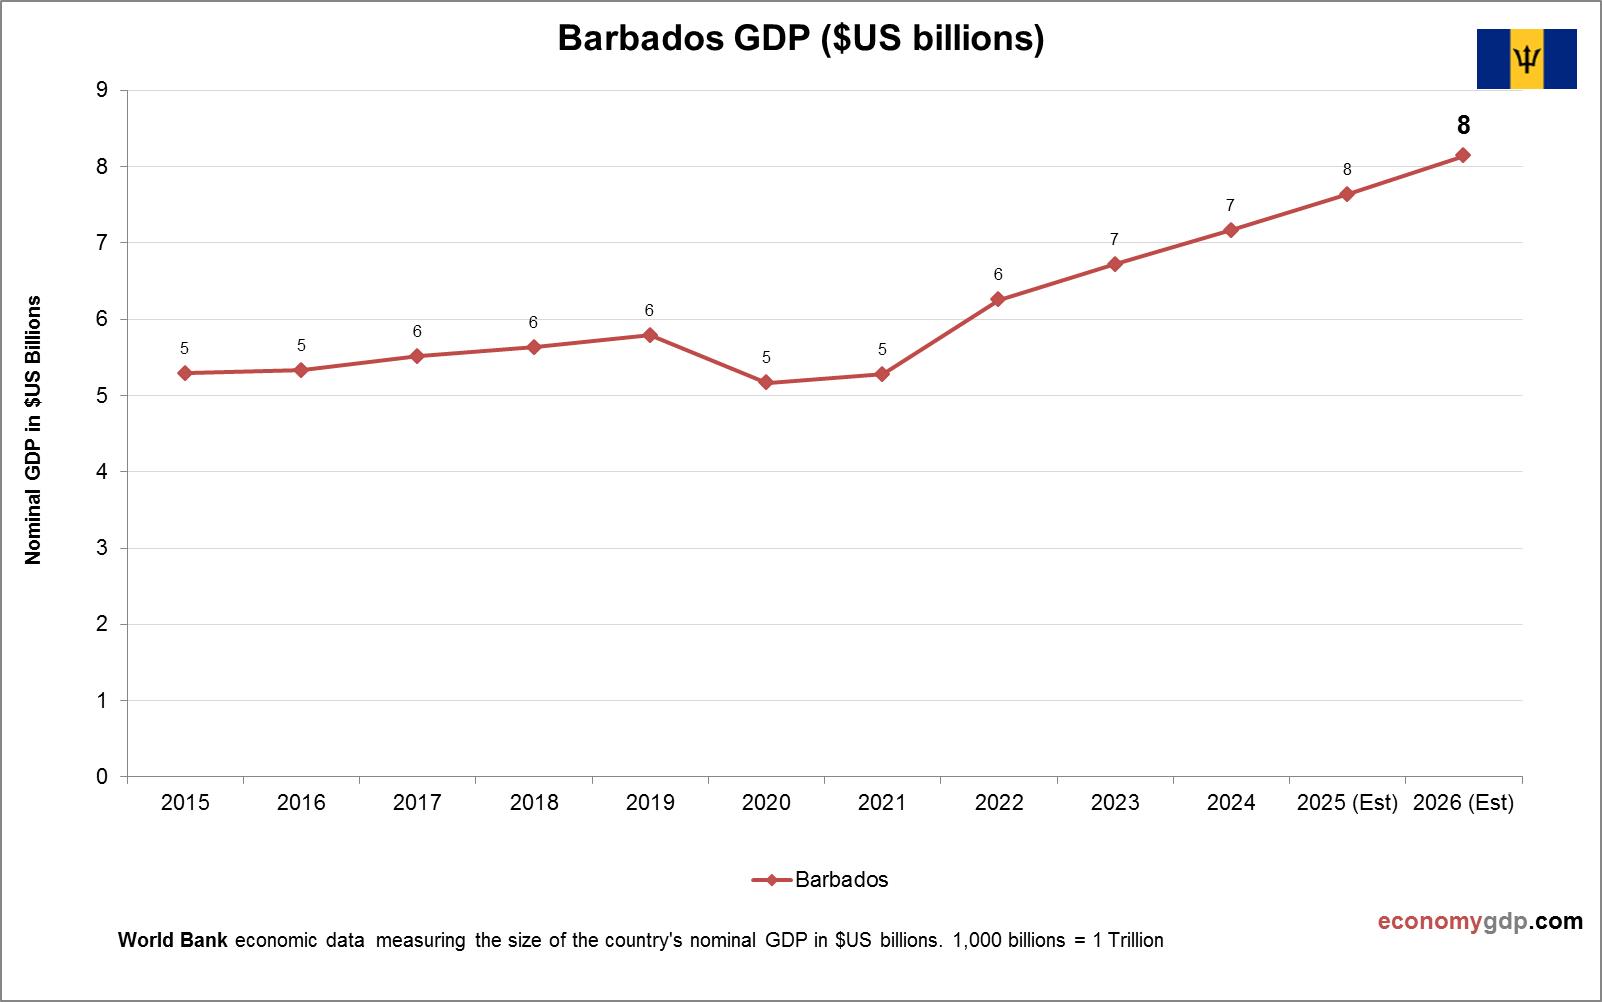
Barbados GDP

Barbados GDP

Barbados's $5.5 billion economy, growing 3.5% in 2025, thrives on tourism, offshore finance, and sugar, with per capita GDP at $15,000. Rum exports lead, but fuel imports strain trade for its 280,000 residents. Debt and climate risks challenge progress. Recent View diagram Barbados GDP→

Kiribati GDP

Kiribati GDP

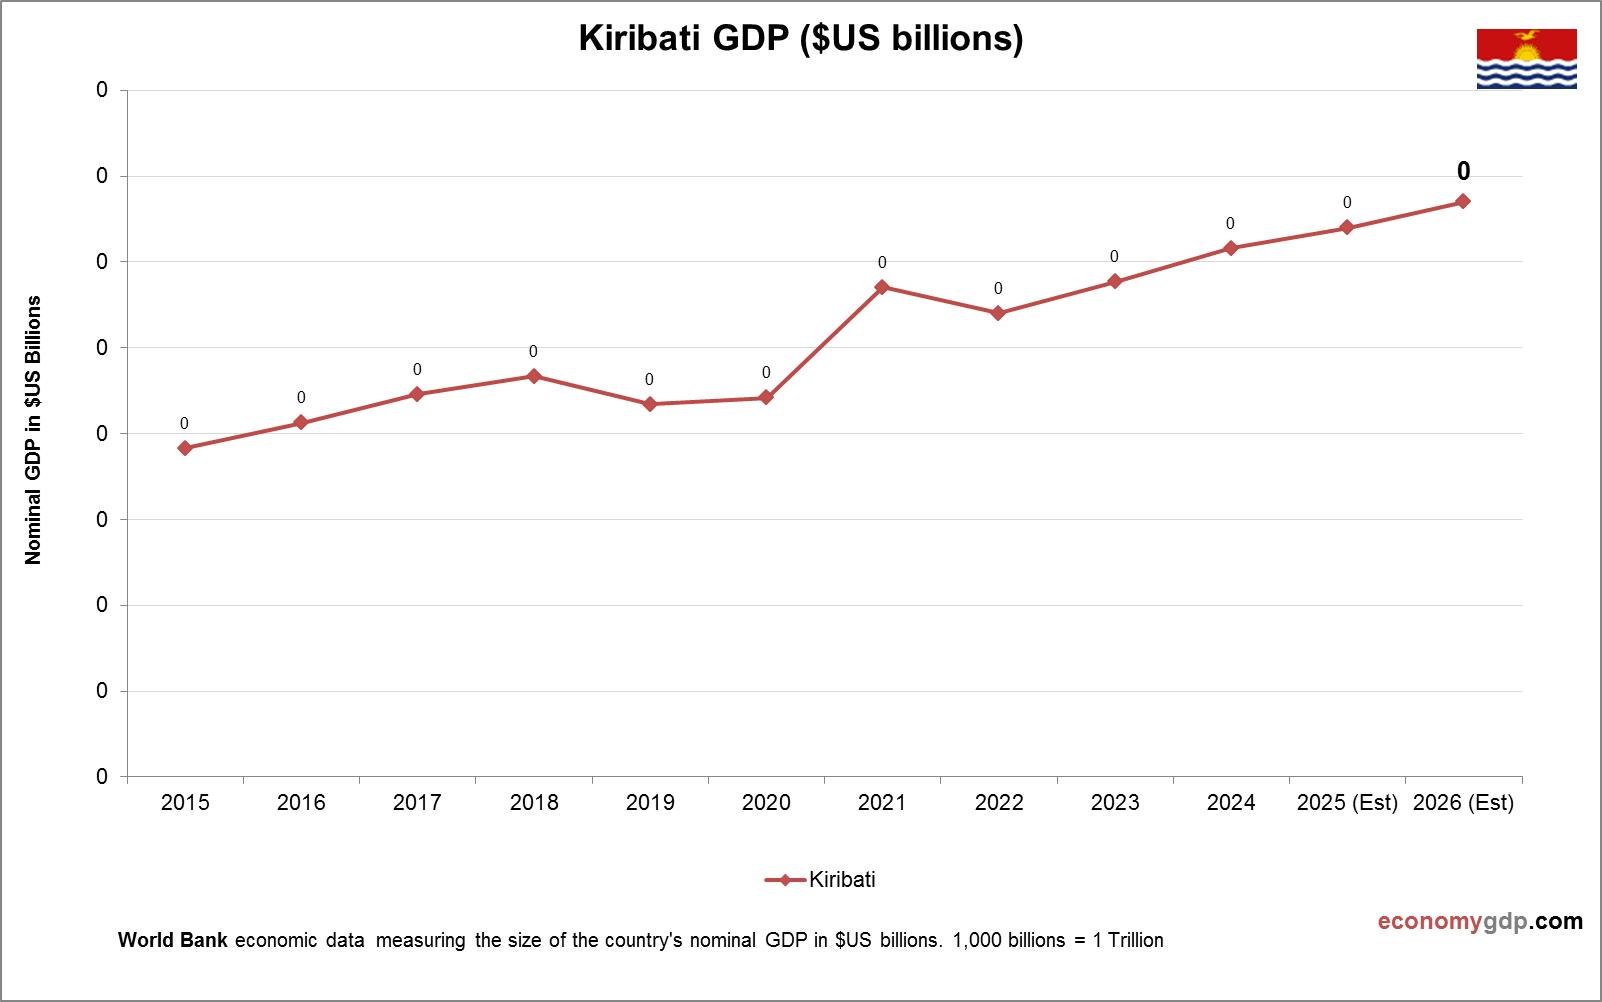
Kiribati's economy is small and vulnerable, relying heavily on fisheries, foreign aid, and remittances. Tuna fishing licenses generate key government revenue, while subsistence agriculture and copra production support local livelihoods. Tourism exists but is limited due to remoteness and infrastructure View diagram Kiribati GDP→

Equatorial Guinea Inflation

Equatorial Guinea Inflation

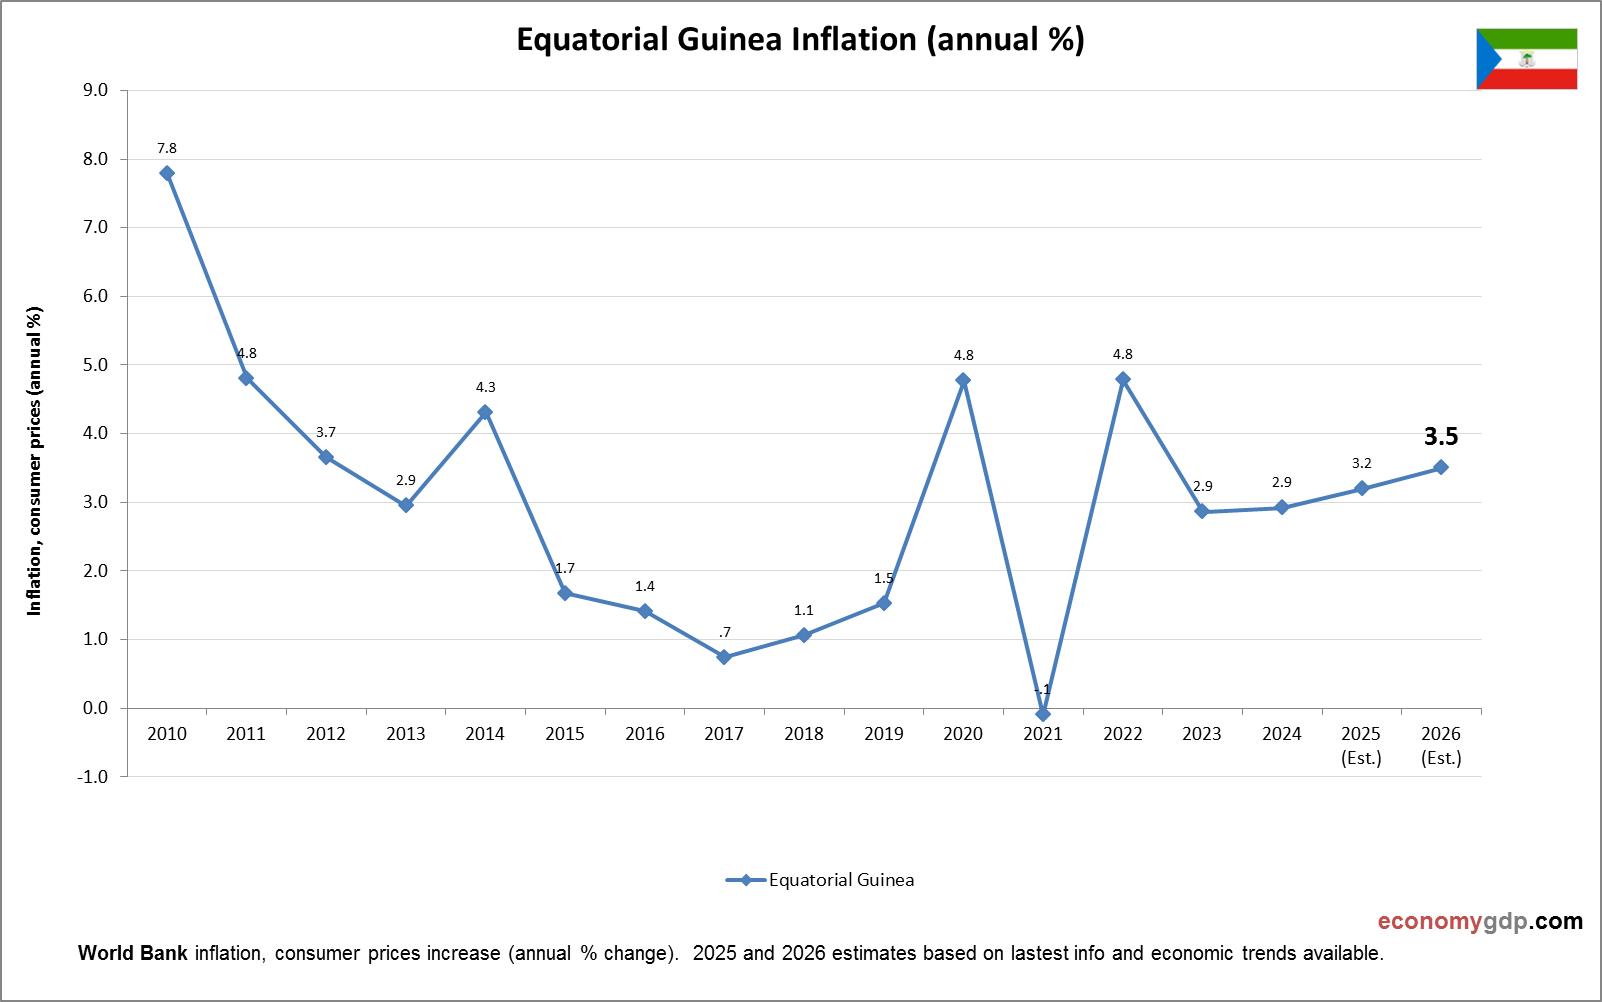
This graph shows Equatorial Guinea Inflation. Inflation data is sourced from World Bank. Change in consumer prices for Equatorial Guinea. Equatorial Guinea experiences inflation due to dependence on oil exports, weak economic diversification, and high import costs for basic goods.