Libya GDP growth rate

Libya GDP growth rate

Libya economy growth rate from 2000 to today. GDP growth (annual %). World Bank and OECD national accounts data. Libya’s economy is driven by oil exports, with periodic recoveries tied to output levels. Ongoing political instability remains a significant constraint View diagram Libya GDP growth rate→

Zambia GDP growth rate

Zambia GDP growth rate

Zambia economy growth rate from 2000 to today. GDP growth (annual %). World Bank and OECD national accounts data. Zambia’s economy is driven by mining, agriculture, and services, with efforts focusing on economic reforms and diversification to sustain growth.

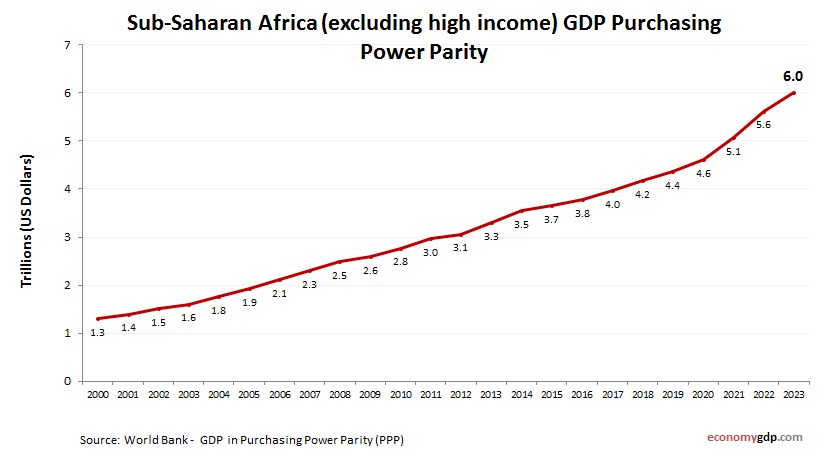
Sub-Saharan Africa (excluding high income) GDP Purchasing Power Parity

Sub-Saharan Africa (excluding high income) GDP Purchasing Power Parity

Sub-Saharan Africa (excluding high income) economy graph showing purchasing power parity (PPP) growth from 2000 to today. Purchasing power parity adjusts the size of the economy to relevant price levels, i.e. measuring the price of specific goods in different countries View diagram Sub-Saharan Africa (excluding high income) GDP Purchasing Power Parity→