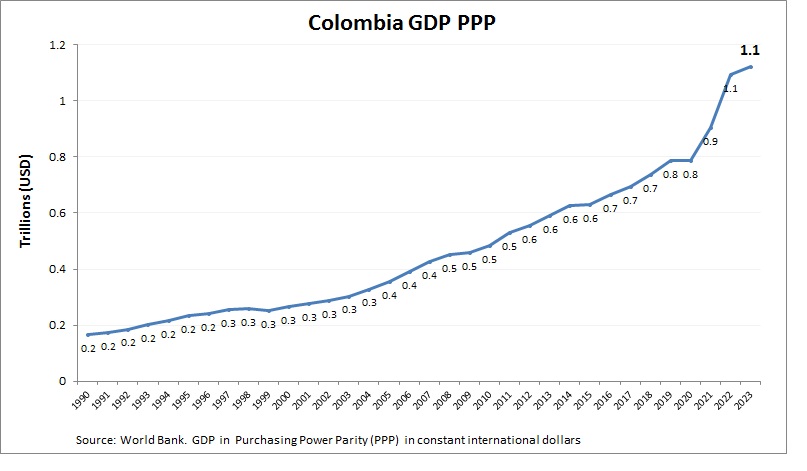
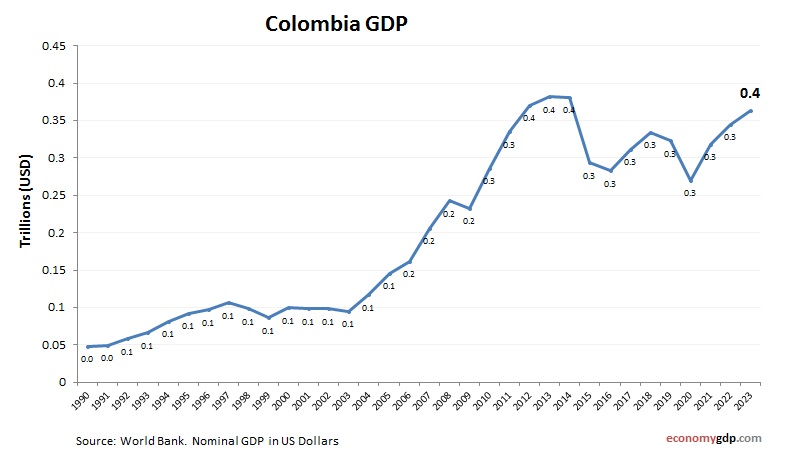
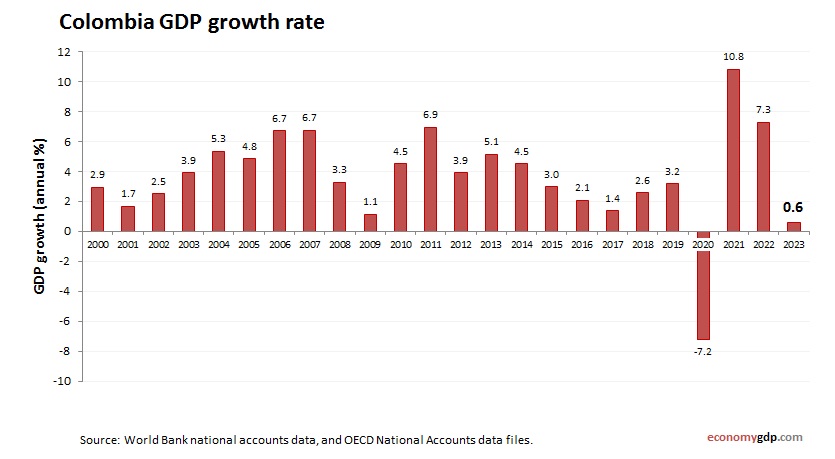
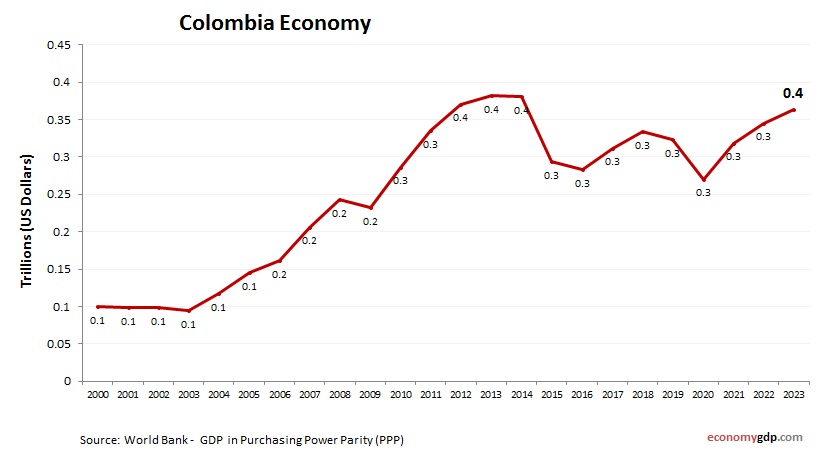
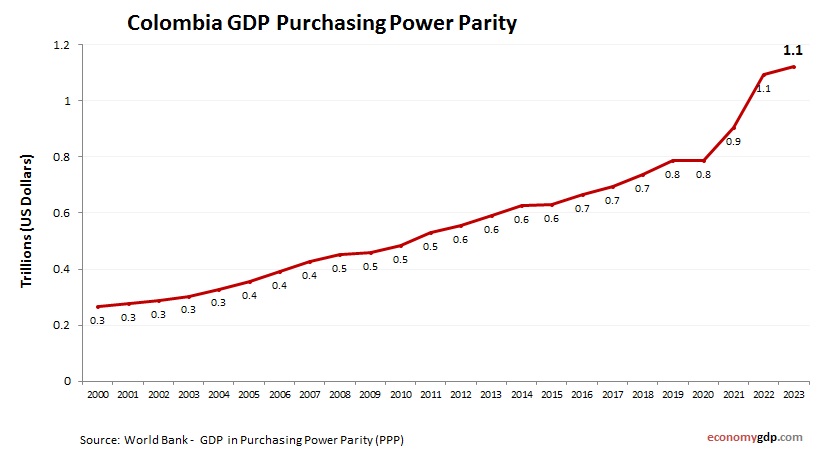
Colombia Economy in Graphs
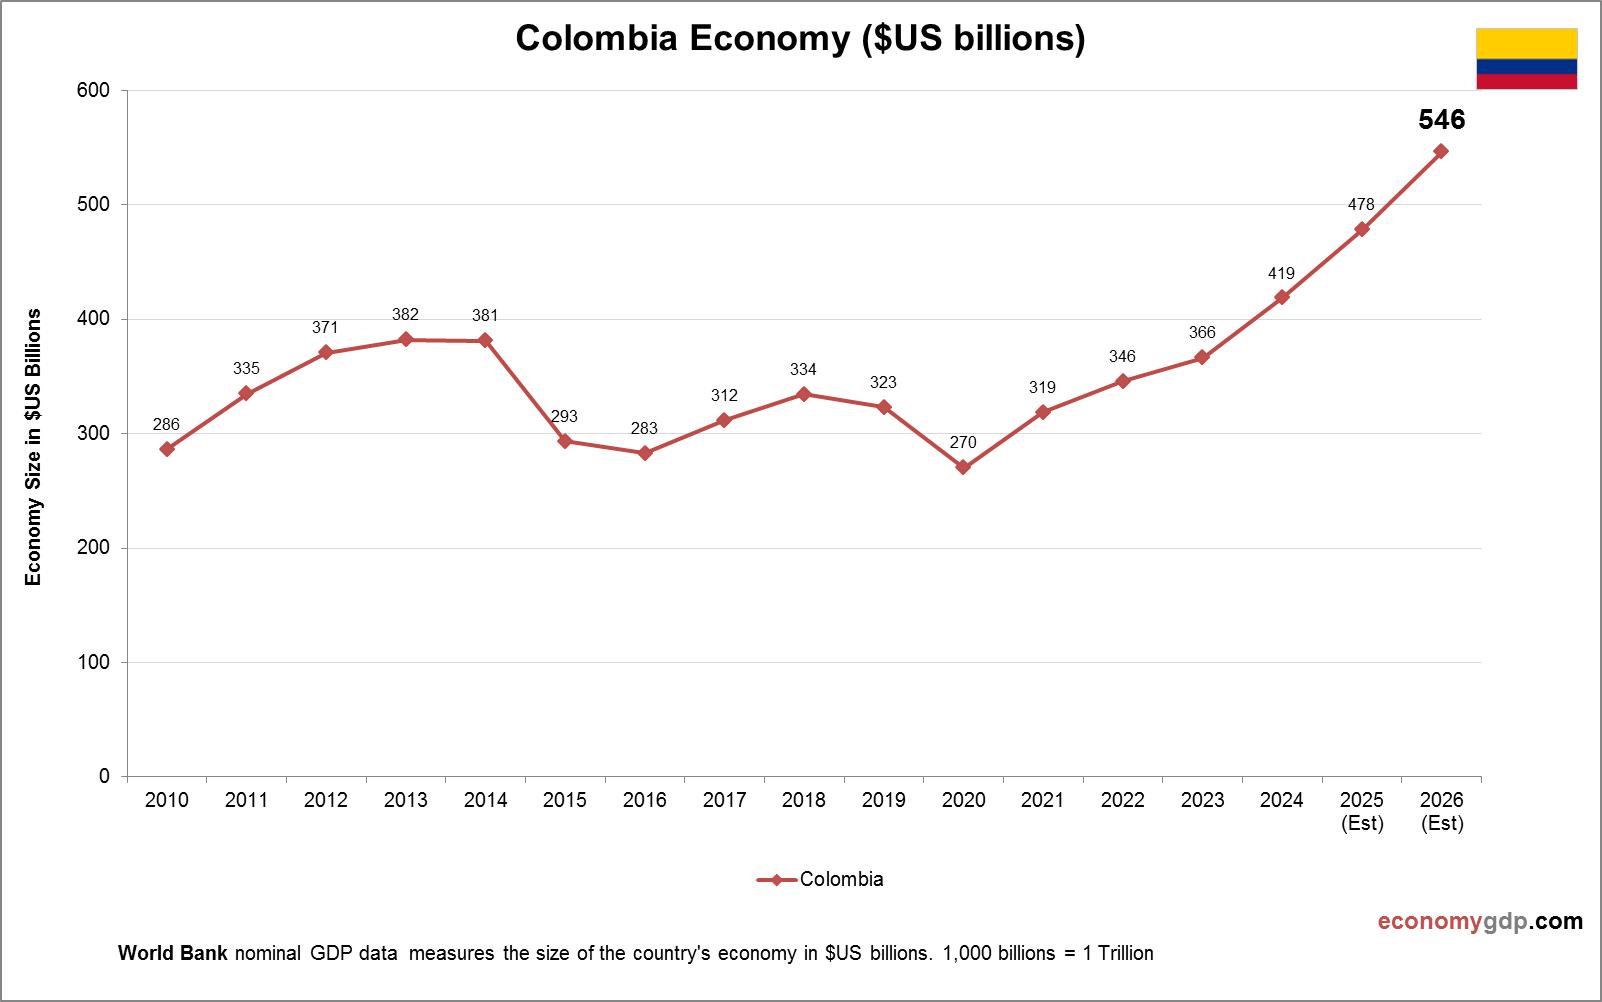
The Colombia economy is fueled by oil, coal, coffee, and emeralds. Services, including finance and tourism, are growing, while agriculture remains vital for rural areas. Peace agreements have spurred investment, but drug trafficking and inequality challenge stability. Infrastructure improvements and View diagram Colombia Economy in Graphs