
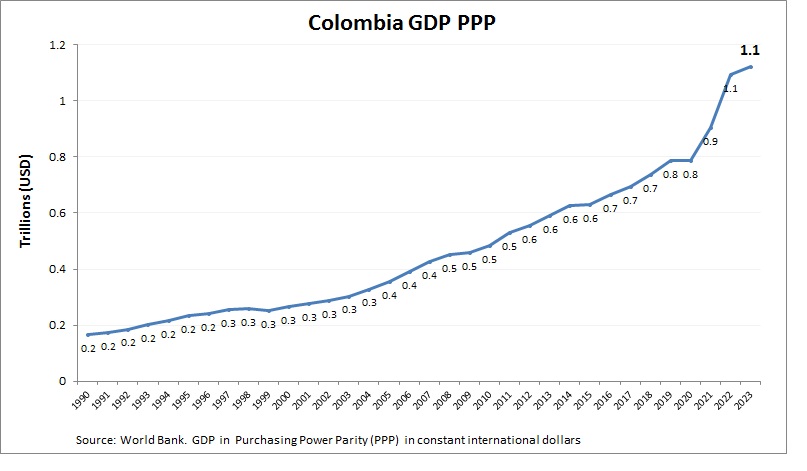
Colombia economy graph showing purchasing power parity (PPP) growth from 2000 to today. Purchasing power parity adjusts the size of the economy to relevant price levels, i.e. measuring the price of specific goods in different countries and adjusting GDP accordingly.
Colombias GDP per capita (PPP) stood around $15,000 in 2023. Key sectors include oil, mining, agriculture, and manufacturing. See all Colombia economy graphs.
Colombia GDP PPP Statistics by Year
| Year | GDP, Purchasing Power Parity (PPP) |
| 2000 | 264.9 |
| 2001 | 275.4 |
| 2002 | 286.7 |
| 2003 | 303.8 |
| 2004 | 328.6 |
| 2005 | 355.2 |
| 2006 | 390.8 |
| 2007 | 428.4 |
| 2008 | 451.0 |
| 2009 | 459.0 |
| 2010 | 485.4 |
| 2011 | 529.9 |
| 2012 | 552.8 |
| 2013 | 589.8 |
| 2014 | 621.9 |
| 2015 | 626.2 |
| 2016 | 665.4 |
| 2017 | 693.1 |
| 2018 | 747.1 |
| 2019 | 807.6 |
| 2020 | 785.7 |
| 2021 | 889.8 |
| 2022 | 1,078.9 |
| 2023 | 1,111.6 |
| 2024 | 1,182.0 |
| 2025 (Est.) | 1,250.0 |
| 2026 (Est.) | 1,320.0 |