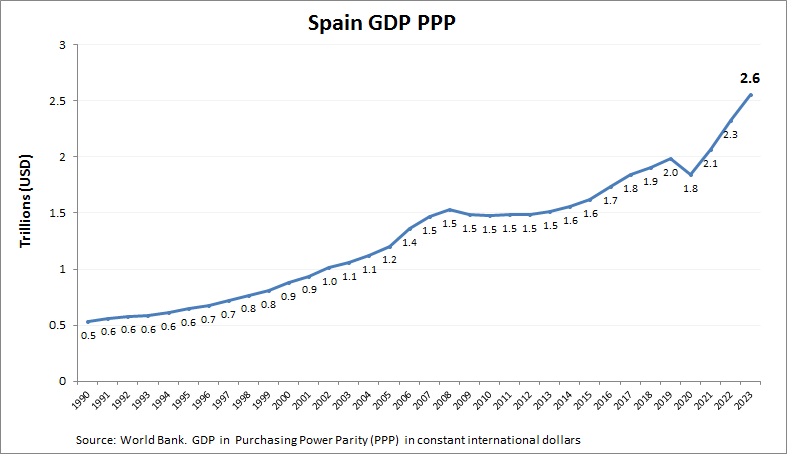
Spain GDP PPP
Spain economy graph showing purchasing power parity (PPP) growth from 1990 to today. Purchasing power parity adjusts the size of the economy to relevant price levels, i.e. measuring the price of specific goods in different countries and adjusting GDP accordingly. View diagram Spain GDP PPP
Operations Management 101 Critical Path Analysis Part Ii Youtube
I found a video on YouTube that might be helpful. The video is titled “Operations Management 101: Conducting Critical Path Analysis Part 2” and is presented by Brandon Foltz. In this video, Brandon Foltz discusses project management and how to View diagram Operations Management 101 Critical Path Analysis Part Ii Youtube
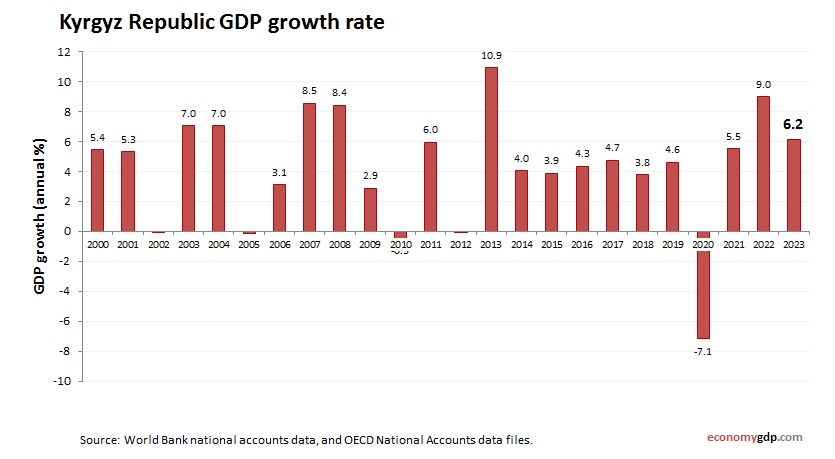
Kyrgyzstan GDP growth rate
Least developed countries GDP growth rate
Least developed countries economy annual growth rate from 2000 to today. GDP growth (yearly %). World Bank and OECD national accounts data. Least Developed Countries (LDCs) globally continued to grapple with significant economic challenges in 2023. These nations often experienced View diagram Least developed countries GDP growth rate
Macao GDP growth rate
Macao economy growth rate from 2000 to today. GDP growth (annual %). World Bank and OECD national accounts data. Macaos economy is centered around tourism and gaming. Recovery efforts are focused on diversification and infrastructure investment to reduce dependency on View diagram Macao GDP growth rate
Information Technology As Part Of The Business Model Of The Firm
Information technology (IT) has become an integral part of the business model of many firms. According to a recent article in Forbes, IT has completely changed the structure of modern corporations . IT has enabled corporations to move more of View diagram Information Technology As Part Of The Business Model Of The Firm
Namibia GDP growth rate
Namibia economy growth rate from 2000 to today. GDP growth (annual %). World Bank and OECD national accounts data. Namibia’s economy has experienced fluctuations, influenced by mining and agriculture sectors. The country continues to focus on diversification and addressing challenges View diagram Namibia GDP growth rate
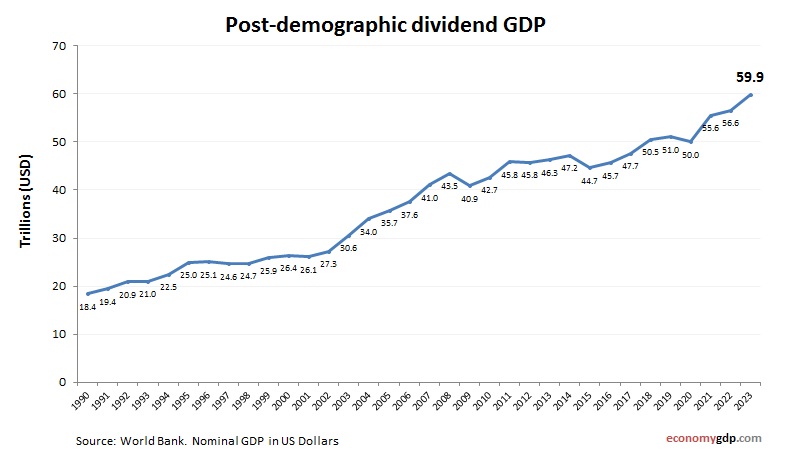
Post-demographic dividend GDP
Post-demographic dividend GDP from 1990 to today. World Bank and OECD data. GDP in US dollars. Economies in this stage have high GDP per capita but face aging populations. Growth depends on boosting productivity, investing in health and tech, and View diagram Post-demographic dividend GDP
Bahamas GDP growth rate
Bahamas economy growth rate from 2000 to today. GDP growth (annual %). World Bank and OECD national accounts data. The Bahamas experienced a GDP growth rate of 2.64% in 2023, a decrease from the previous year’s 10.78%. The slowdown is View diagram Bahamas GDP growth rate