Europe and Central Asia (IDA and IBRD countries) GDP Purchasing Power Parity
Europe and Central Asia (IDA and IBRD countries) economy graph showing purchasing power parity (PPP) growth from 2000 to today. Purchasing power parity adjusts the size of the economy to relevant price levels, i.e. measuring the price of specific goods View diagram Europe and Central Asia (IDA and IBRD countries) GDP Purchasing Power Parity
Investment Strategies Treasury Today
I found a website called Treasury Today that provides insights into investment strategies. They discuss the implications of the financial crisis on investing and how treasurers and other investors have to balance their needs in relation to security, liquidity, and View diagram Investment Strategies Treasury Today
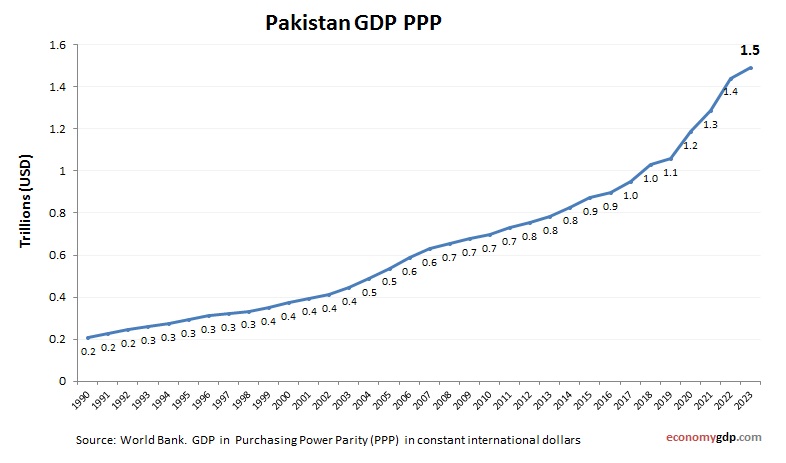
Pakistan GDP PPP
Pakistan economy graph showing purchasing power parity (PPP) growth from 2000 to today. Purchasing power parity adjusts the size of the economy to relevant price levels, i.e. measuring the price of specific goods in different countries and adjusting GDP accordingly. View diagram Pakistan GDP PPP
Egypt GDP growth rate
Egypt, Arab Rep. economy annual growth rate from 2000 to today. GDP growth (yearly %). World Bank and OECD national accounts data. Egypt’s economy grew by 4.2% in 2023. The expansion was driven by strong performance in sectors like construction, View diagram Egypt GDP growth rate
Egypt GDP Purchasing Power Parity
Egypt economy graph showing purchasing power parity (PPP) growth from 2000 to today. Purchasing power parity adjusts the size of the economy to relevant price levels, i.e. measuring the price of specific goods in different countries and adjusting GDP accordingly. View diagram Egypt GDP Purchasing Power Parity
Honduras GDP growth rate
Honduras economy growth rate from 2000 to today. GDP growth (annual %). World Bank and OECD national accounts data. Honduras experienced moderate economic growth, supported by agriculture, remittances, and light manufacturing. Efforts to attract foreign investment and improve infrastructure are View diagram Honduras GDP growth rate
Lithuania GDP growth rate
South Asia GDP
South Asia GDP from 2010 to today. World Bank and OECD data. GDP in US dollars. South Asia, home to nearly a quarter of the world's population, has a rapidly expanding GDP driven by services, manufacturing, and agriculture. India dominates View diagram South Asia GDP