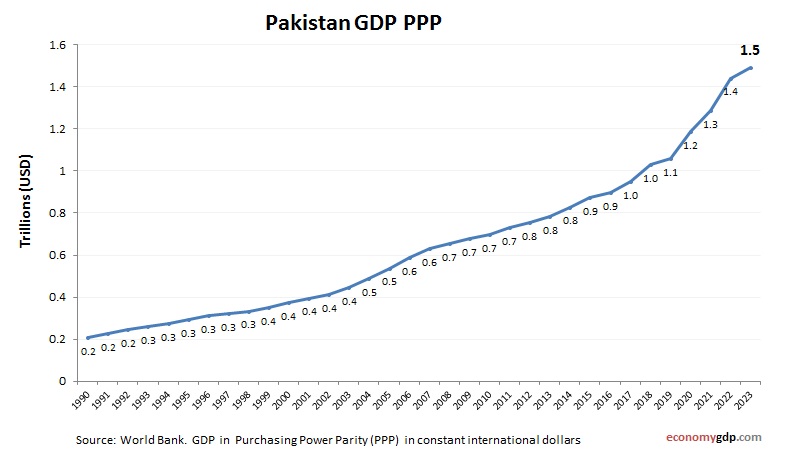
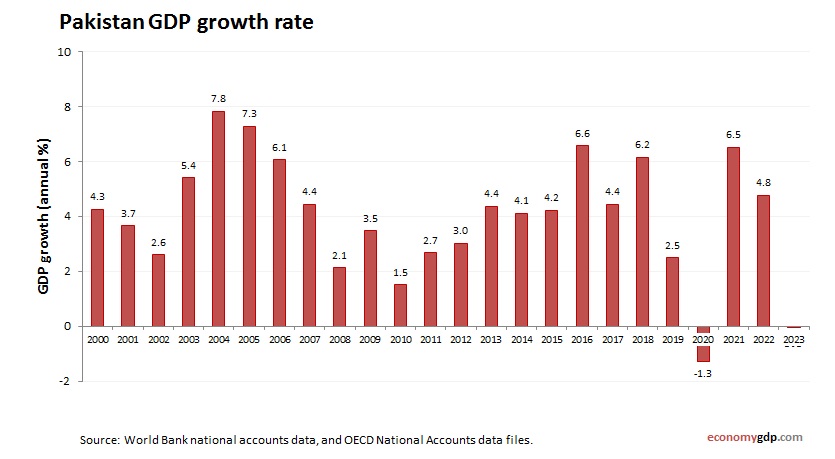
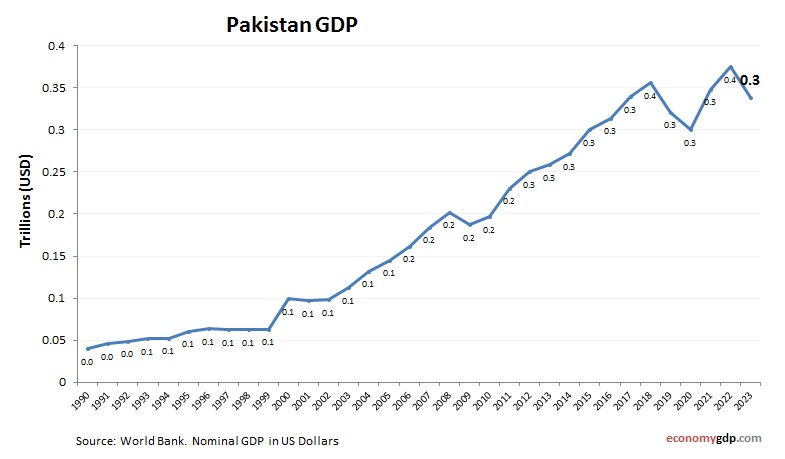
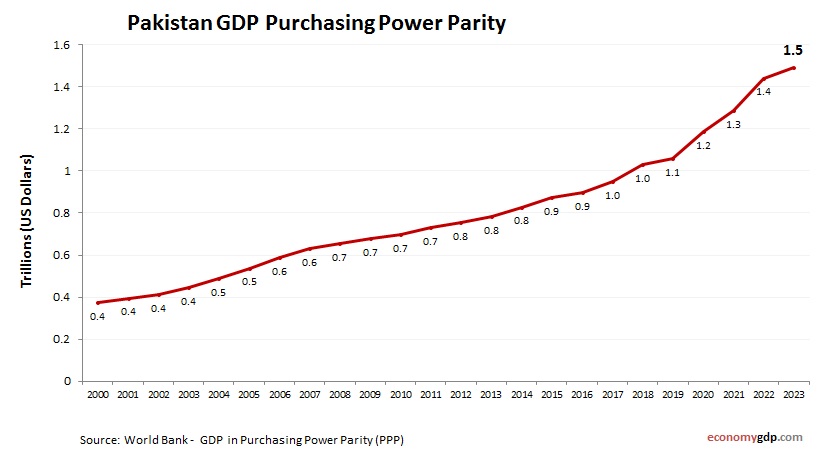
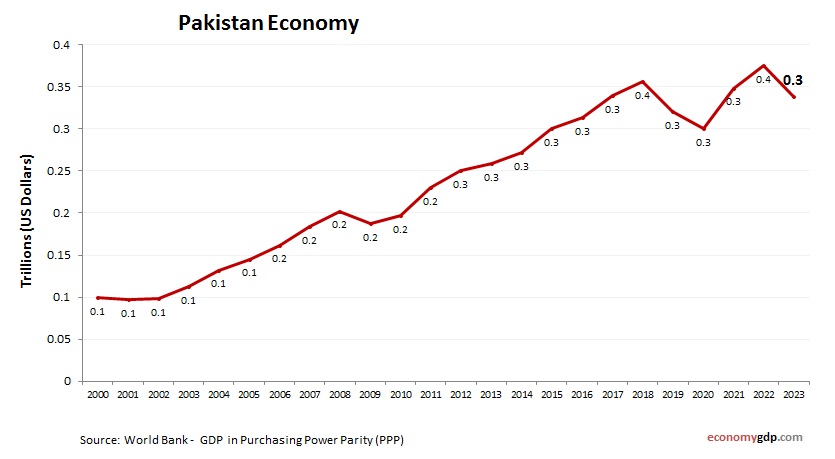
Pakistan Economy in Graphs
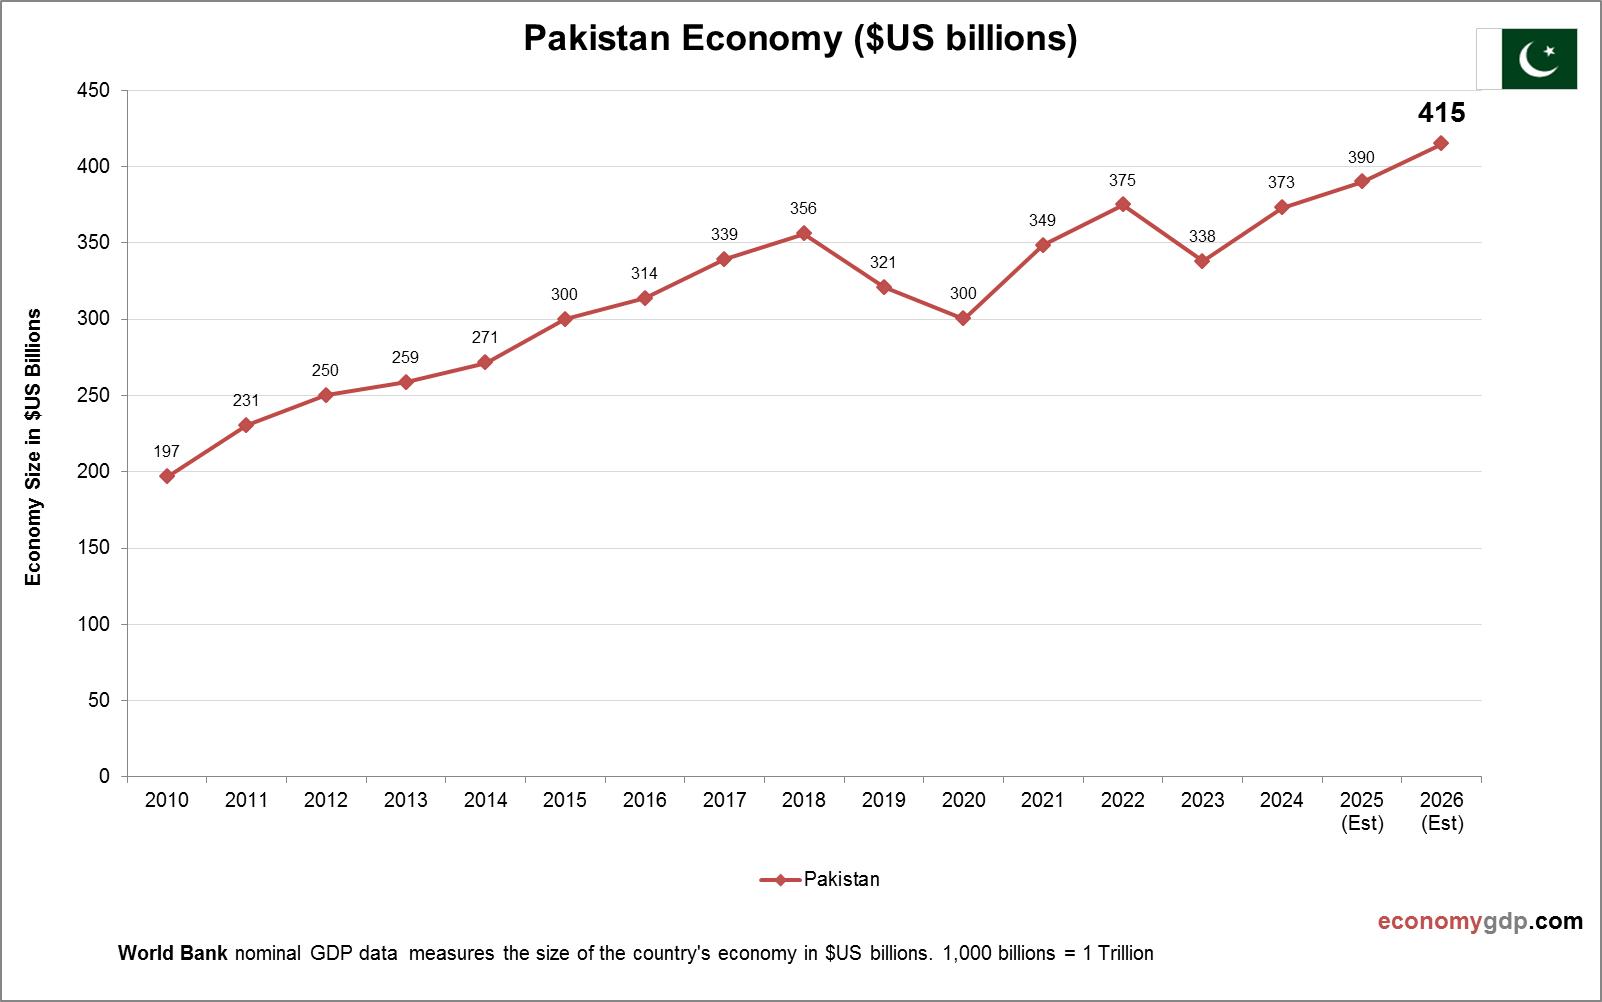
Pakistan’s economy, worth $350 billion, relies on agriculture, which employs 40% of the workforce and produces cotton, wheat, and rice. Textiles dominate exports, contributing 60% of foreign earnings. The IT sector is emerging, with growing freelancing and tech startups in View diagram Pakistan Economy in Graphs