Skip to content
cropped-economygdp.jpg

Economy GDP

World economy charts, business frameworks and diagrams

Menu

Primary menu

  • Economy
    • Top Economies
  • Demographics
  • Business
    • Strategy
    • Project Management
    • Industry Examples
    • Leadership
    • HR
    • Industry Examples
  • Framework
  • Analysis
  • Lean Six Sigma
    • Lean
  • IT
    • Social Media
  • Marketing
  • Stories
  • Top

Tag Archives: Spain statistics

Spain Inflation

Spain Inflation

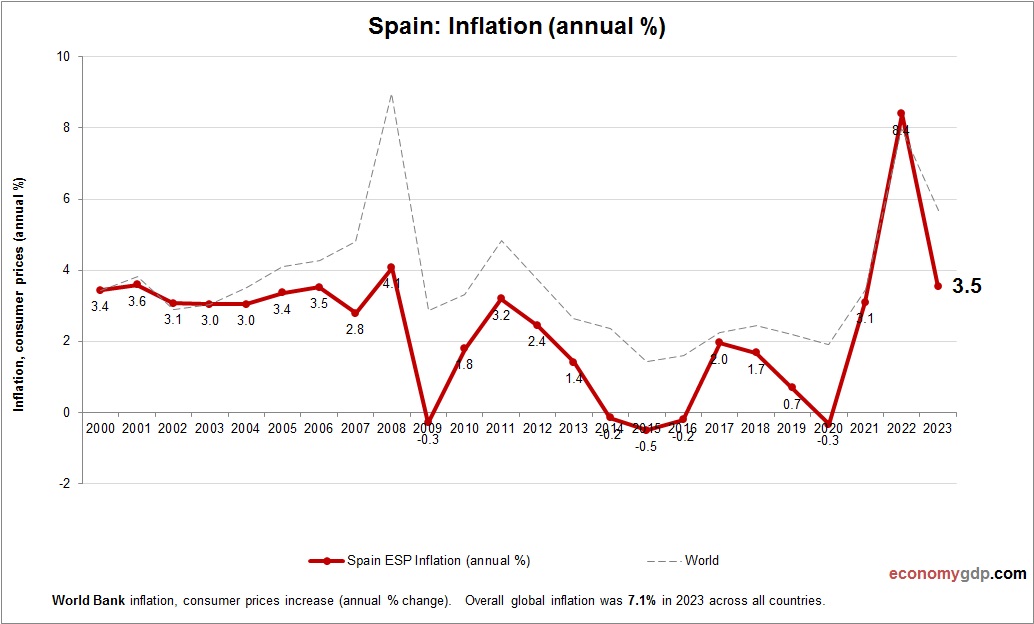
This chart demonstrates Spain Inflation. Inflation data is sourced from World Bank. Change in consumer prices for Spain. Spain’s inflation is driven by energy prices, housing demand, and EU policy effects. Post-pandemic tourism recovery and labor costs also contribute to View diagram Spain Inflation→

Posted in Economy | Tagged Spain economy, Spain statistics

Spain GDP per capita

Spain GDP per capita

This diagram presents Spain GDP per capita. This is according to World Bank GDP stats by country. Based on the latest economic info provided for Spain. Spain’s GDP per capita in 2024 is estimated at approximately $34,000. Spain’s economy is View diagram Spain GDP per capita→

Posted in Economy | Tagged Spain economy, Spain statistics

Spain Children Per woman

Spain Children Per woman

The above graph shows Spain Children Per woman. World Bank is the source of this birth data. Latest births per woman information for Spain. Spain has one of the lowest children per woman rates in Europe. Economic challenges, delayed family View diagram Spain Children Per woman→

Posted in Demographics | Tagged Spain demographics, Spain statistics

Spain GDP PPP

Spain GDP PPP

Spain economy graph showing purchasing power parity (PPP) growth from 1990 to today. Purchasing power parity adjusts the size of the economy to relevant price levels, i.e. measuring the price of specific goods in different countries and adjusting GDP accordingly. View diagram Spain GDP PPP→

Posted in Economy | Tagged Spain, Spain economy, Spain gdp, Spain statistics

Spain GDP Purchasing Power Parity

Spain GDP Purchasing Power Parity

Spain economy graph showing purchasing power parity (PPP) growth from 2000 to today. Purchasing power parity adjusts the size of the economy to relevant price levels, i.e. measuring the price of specific goods in different countries and adjusting GDP accordingly. View diagram Spain GDP Purchasing Power Parity→

Posted in Economy | Tagged Spain, Spain economy, Spain gdp, Spain statistics

Primary Sidebar Widget Area

Top Diagrams

Latest Posts

  • North Korea Economy in Graphs
  • New Zealand Economy in Graphs
  • Mozambique Economy in Graphs
  • Morocco Economy in Graphs
  • Mongolia Economy in Graphs
  • Mali Economy in Graphs
  • Malaysia Economy in Graphs
  • Luxembourg Economy in Graphs
  • Lithuania Economy in Graphs
  • Libya Economy in Graphs
  • Liberia Economy in Graphs
  • Kyrgyzstan Economy in Graphs
  • Kuwait Economy in Graphs
  • Jordan Economy in Graphs
  • Iraq Economy in Graphs
  • Twitter
Copyright © 2026 Economy GDP. All Rights Reserved.
Theme: Catch Box by Catch Themes
Scroll Up