New Zealand GDP

New Zealand GDP

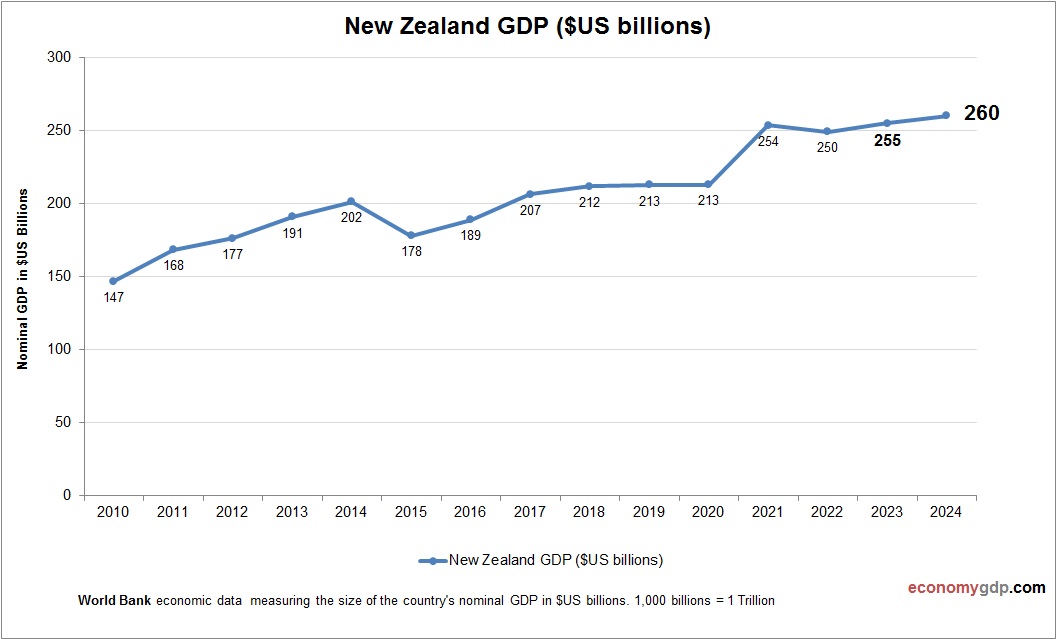
New Zealand's $250 billion economy, growing 2.5% in 2025, thrives on dairy, tourism, and tech, with per capita GDP near $48,000. Meat exports dominate, while machinery imports support industry. Housing affordability poses challenges. Recent trade agreements and Maori-led partnerships enhance View diagram New Zealand GDP→

Kenya Economy in Graphs

The Kenya economy is a regional hub, driven by agriculture, services, and technology. Tea, coffee, and horticulture are major exports, while Nairobi’s tech scene, dubbed “Silicon Savannah,” fosters innovation. Tourism, including safaris, is significant, though political instability and drought pose View diagram Kenya Economy in Graphs→

Guatemala Economy

Guatemala Economy

Guatemala's economy centers on coffee, sugar, and textiles. Remittances support. Guatemala City's services. Challenges include inequality. Efforts target tourism to Maya sites. Central position boosts trade. World Bank Data. 2000-2024. Last updated Oct 2025. Refer to the latest year-over-year Guatemala View diagram Guatemala Economy→

Uruguay Economy

Uruguay Economy

Uruguay's economy is stable, with agriculture exporting beef, soy, and rice. Services, including finance and IT, dominate in Montevideo. Tourism thrives on beaches and colonial sites. Renewable energy, mainly wind and hydro, leads globally. Pulp mills and logistics via ports View diagram Uruguay Economy→

Hong Kong Economy

Hong Kong Economy

Hong Kong's economy is finance-led, global hub. Trade and logistics via port. Tourism recovers. Challenges include Beijing control. Efforts target innovation. Asian gateway ensures dynamism. World Bank Data. 2000-2024. Last updated Oct 2025. Refer to the latest year-over-year Hong Kong View diagram Hong Kong Economy→

Customer Journey Diagram Illustrated Representation

Customer Journey Diagram Illustrated Representation

Customer Journey Diagram Illustrated Representation: A customer journey diagram illustrated representation is a visual tool used to map out the steps a customer takes when interacting with a brand, from initial awareness to post-purchase interactions. The diagram highlights key touchpoints, View diagram Customer Journey Diagram Illustrated Representation→