Skip to content
cropped-economygdp.jpg

Economy GDP

World economy charts, business frameworks and diagrams

Menu

Primary menu

  • Economy
    • Top Economies
  • Demographics
  • Business
    • Strategy
    • Project Management
    • Industry Examples
    • Leadership
    • HR
    • Industry Examples
  • Framework
  • Analysis
  • Lean Six Sigma
    • Lean
  • IT
    • Social Media
  • Marketing
  • Stories
  • Top

Tag Archives: Liberia statistics

Liberia Fertility Rate

Liberia Fertility Rate

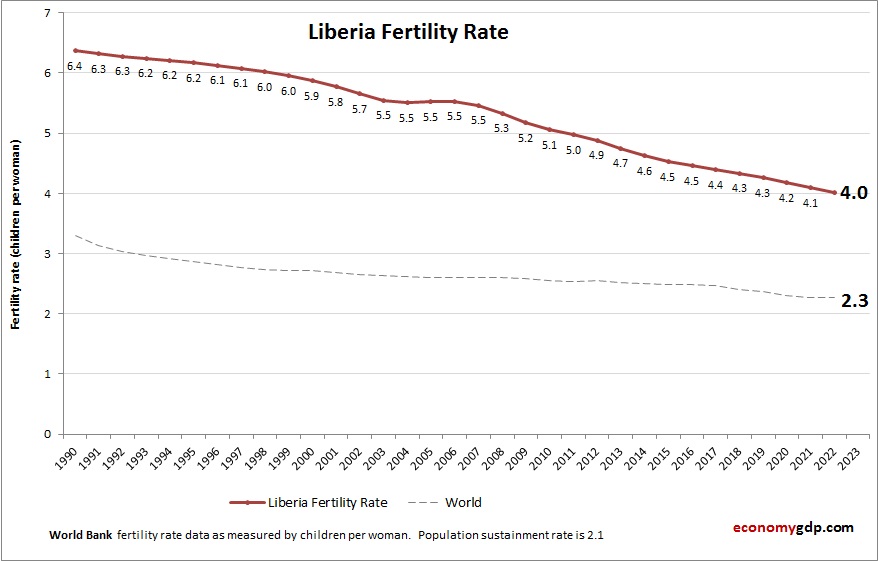
The above graph shows Liberia Fertility Rate. This is according to World Bank birth stats by country. Based on the latest available information for Liberia. Liberia’s fertility rate is high but declining slowly due to improving education and healthcare. See View diagram Liberia Fertility Rate→

Posted in Demographics | Tagged Liberia demographics, Liberia statistics

Liberia GDP Purchasing Power Parity

Liberia GDP Purchasing Power Parity

Liberia’s GDP (PPP) is estimated at $10.4 billion in 2025. Liberia’s economy depends on mining (iron ore, gold), agriculture (rubber), and foreign aid. The PPP adjustment significantly boosts GDP due to a low cost of living. Post-conflict recovery is slow, View diagram Liberia GDP Purchasing Power Parity→

Posted in Economy | Tagged Liberia, Liberia economy, Liberia GDP, Liberia statistics

Primary Sidebar Widget Area

Top Diagrams

Latest Posts

  • North Korea Economy in Graphs
  • New Zealand Economy in Graphs
  • Mozambique Economy in Graphs
  • Morocco Economy in Graphs
  • Mongolia Economy in Graphs
  • Mali Economy in Graphs
  • Malaysia Economy in Graphs
  • Luxembourg Economy in Graphs
  • Lithuania Economy in Graphs
  • Libya Economy in Graphs
  • Liberia Economy in Graphs
  • Kyrgyzstan Economy in Graphs
  • Kuwait Economy in Graphs
  • Jordan Economy in Graphs
  • Iraq Economy in Graphs
  • Twitter
Copyright © 2026 Economy GDP. All Rights Reserved.
Theme: Catch Box by Catch Themes
Scroll Up