IT Change Management Process Sample of

IT Change Management Process Sample of

IT Change Management Process Sample of: An IT change management process sample outlines how organizations can effectively manage and implement changes to their IT infrastructure. This includes steps like identifying the need for change, planning the change, assessing its impact, View diagram IT Change Management Process Sample of→

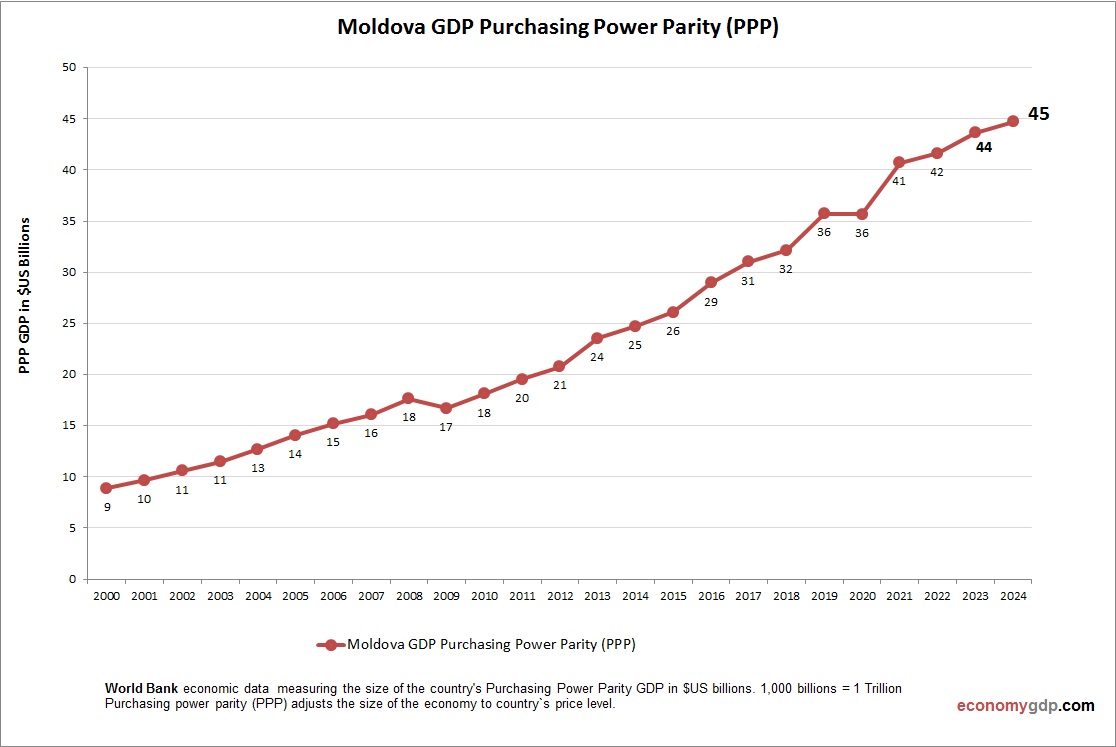
Moldova GDP PPP

Moldova GDP PPP

Moldova’s PPP GDP was $41.8 billion in 2023. Agriculture, remittances, and services are key, with GDP per capita (PPP) at $16,300. EU integration and trade agreements support growth, but political instability and corruption hinder progress. Infrastructure investment is critical.[](https://data.opendatasoft.com/explore/dataset/gdp-ppp-the-world-bank%40kapsarc/) See View diagram Moldova GDP PPP→

Tonga Inflation

Tonga Inflation

This diagram presents Tonga Inflation. Inflation data is sourced from World Bank. Change in consumer prices for Tonga. Tonga faces inflation driven by high shipping costs, reliance on imported food and fuel, and vulnerability to natural disasters disrupting supply chains.

Business Capabilities Model

Business Capabilities Model

Business Capabilities Model: The business capabilities model outlines the critical functions and resources that a company must possess to achieve its strategic objectives. It categorizes capabilities into various areas such as operations, customer service, IT, and marketing. By defining and View diagram Business Capabilities Model→

North Korea Inflation

North Korea Inflation

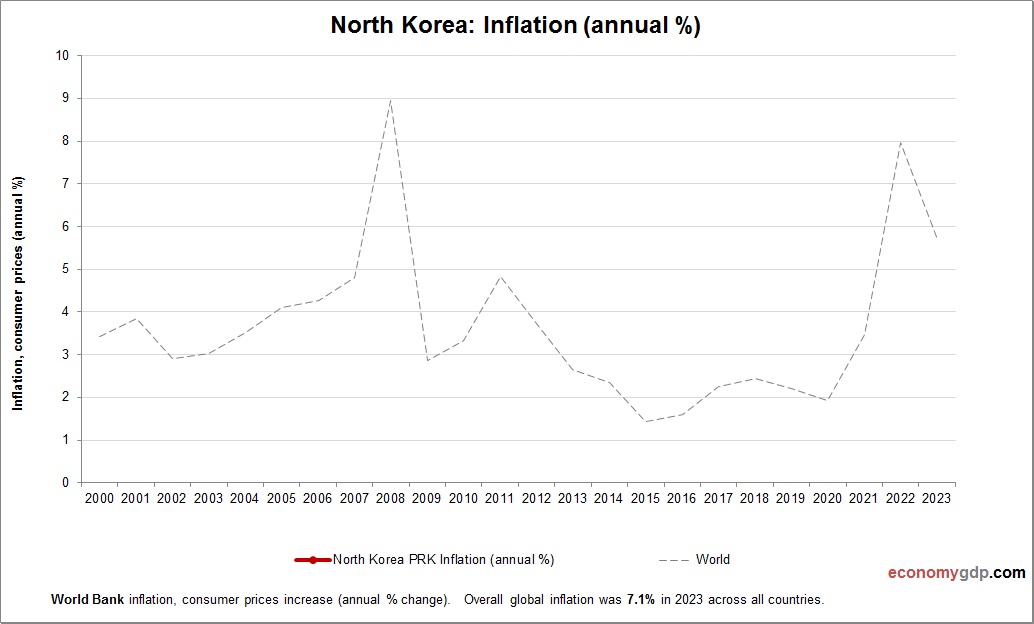
This graph shows North Korea Inflation. This is according to World Bank consumer price index stats by country. Based on the latest economic data provided for North Korea. North Korea experiences unofficial inflation due to its closed economy, international sanctions, View diagram North Korea Inflation→

Silk Road Early Global Trade Network

The Silk Road, connecting China to Europe, revolutionized early commerce. Beyond goods like silk and spices, it spread culture, religion, and technology. This vast trade network laid the foundation for globalization centuries before the term existed.

Togo GDP per capita

Togo GDP per capita

This graph shows Togo GDP per capita. The economic data is provided by World Bank. Based on the latest available information for Togo. Togo’s GDP per capita in 2024 is estimated at approximately $900. The economy is largely driven by View diagram Togo GDP per capita→