
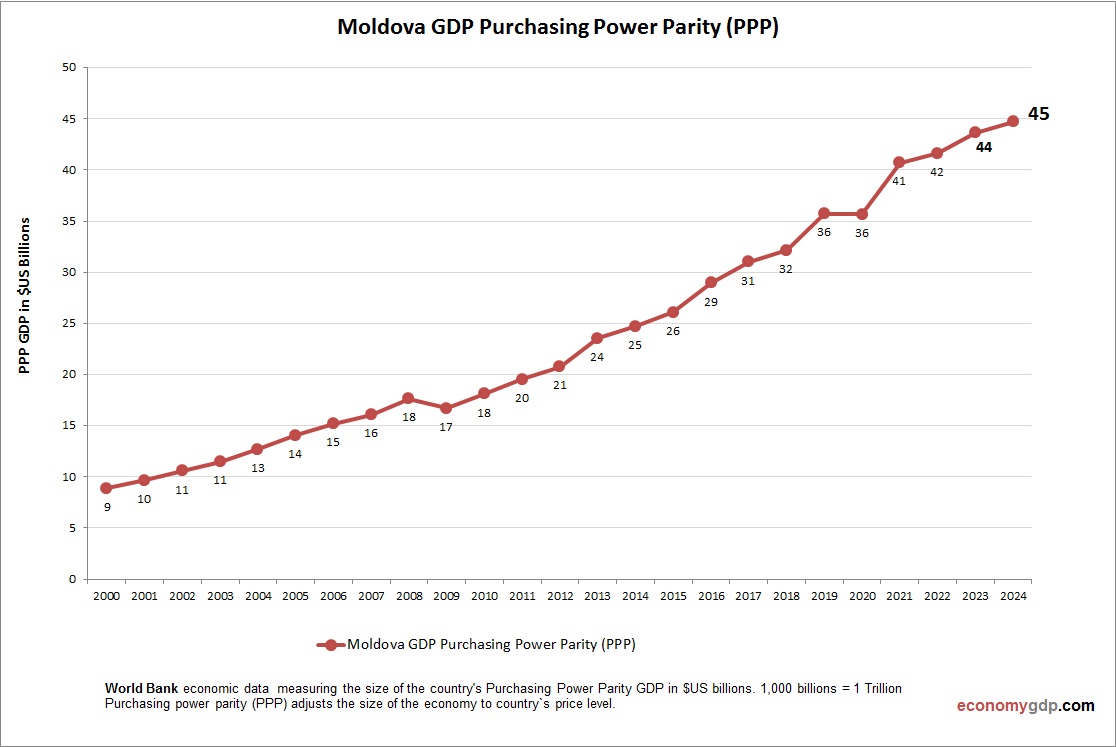
Moldovas PPP GDP was $41.8 billion in 2023. Agriculture, remittances, and services are key, with GDP per capita (PPP) at $16,300. EU integration and trade agreements support growth, but political instability and corruption hinder progress. Infrastructure investment is critical.[](https://data.opendatasoft.com/explore/dataset/gdp-ppp-the-world-bank%40kapsarc/) See all Moldova economy graphs.
Moldova GDP PPP Statistics by Year
| Year | GDP, Purchasing Power Parity (PPP) |
| 2000 | 8.9 |
| 2001 | 9.7 |
| 2002 | 10.6 |
| 2003 | 11.5 |
| 2004 | 12.7 |
| 2005 | 14.1 |
| 2006 | 15.2 |
| 2007 | 16.1 |
| 2008 | 17.7 |
| 2009 | 16.7 |
| 2010 | 18.1 |
| 2011 | 19.5 |
| 2012 | 20.8 |
| 2013 | 23.5 |
| 2014 | 24.7 |
| 2015 | 26.1 |
| 2016 | 28.9 |
| 2017 | 31.0 |
| 2018 | 32.1 |
| 2019 | 35.7 |
| 2020 | 35.6 |
| 2021 | 40.7 |
| 2022 | 41.6 |
| 2023 | 43.6 |
| 2024 | 44.7 |
| 2025 (Est.) | 46.5 |
| 2026 (Est.) | 48.5 |