
Hungarys PPP GDP was $360.2 billion in 2023. Manufacturing, services, and agriculture drive the economy, with GDP per capita (PPP) at $37,300. EU membership supports trade, but political tensions and brain drain pose challenges. Automotive and tech sectors are growing, though reliance on foreign investment requires stability.[](https://ec.europa.eu/eurostat/statistics-explained/index.php?title=Purchasing_power_parities_and_GDP_per_capita_-_preliminary_estimate) See all Hungary economy graphs.
Hungary GDP PPP Statistics by Year
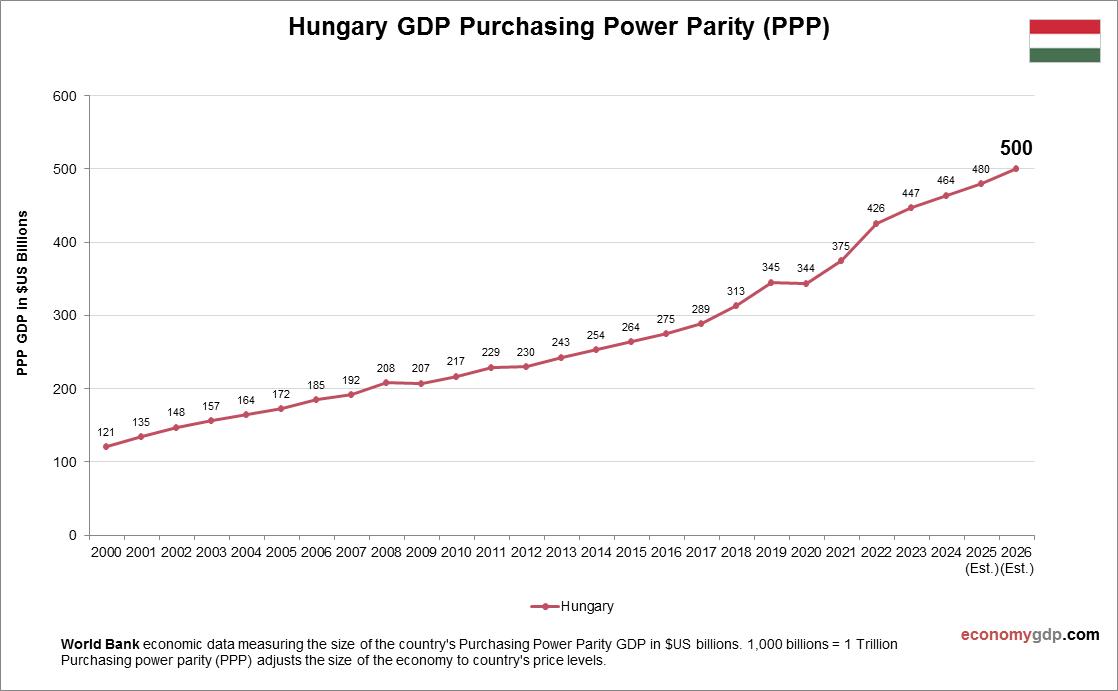
| Year | GDP, Purchasing Power Parity (PPP) |
| 2000 | 121.2 |
| 2001 | 134.7 |
| 2002 | 147.6 |
| 2003 | 156.6 |
| 2004 | 164.2 |
| 2005 | 172.4 |
| 2006 | 184.9 |
| 2007 | 192.0 |
| 2008 | 207.9 |
| 2009 | 207.4 |
| 2010 | 216.9 |
| 2011 | 229.3 |
| 2012 | 230.2 |
| 2013 | 242.8 |
| 2014 | 253.7 |
| 2015 | 263.9 |
| 2016 | 275.0 |
| 2017 | 289.2 |
| 2018 | 313.1 |
| 2019 | 345.4 |
| 2020 | 344.1 |
| 2021 | 374.5 |
| 2022 | 426.1 |
| 2023 | 446.9 |
| 2024 | 464.3 |
| 2025 (Est.) | 480.0 |
| 2026 (Est.) | 500.0 |