Middle East and North Africa (IDA and IBRD countries) GDP PPP
Middle East and North Africa (IDA and IBRD countries) economy graph showing purchasing power parity (PPP) growth from 1990 to today. Purchasing power parity adjusts the size of the economy to relevant price levels, i.e. measuring the price of specific View diagram Middle East and North Africa (IDA and IBRD countries) GDP PPP
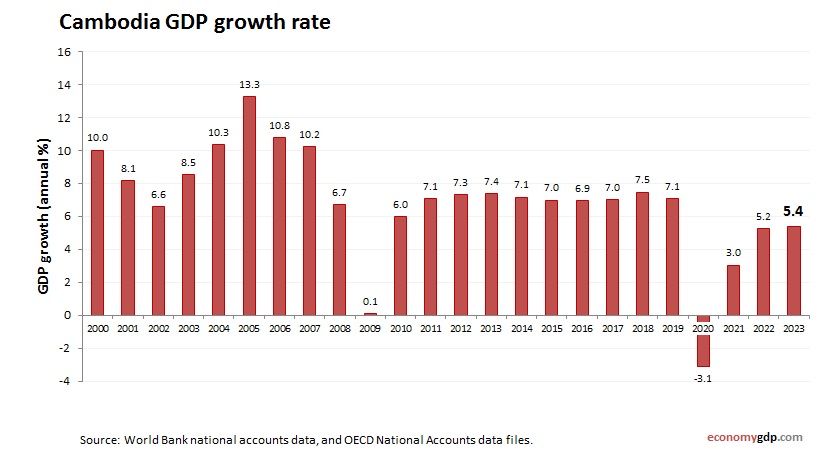
Cambodia GDP growth rate
Cambodia economy growth rate from 2000 to today. GDP growth (annual %). World Bank and OECD national accounts data. Cambodias economy is driven by manufacturing, agriculture, and tourism. The country has been expanding its garment industry and construction sector while View diagram Cambodia GDP growth rate
Turkey GDP
Turkiye GDP from 2010 to today. World Bank and OECD data. GDP in US dollars. Turkey's economy blends modern industry with a large agricultural base, making its GDP one of the largest in the region. Manufacturing, textiles, automotive, and electronics View diagram Turkey GDP
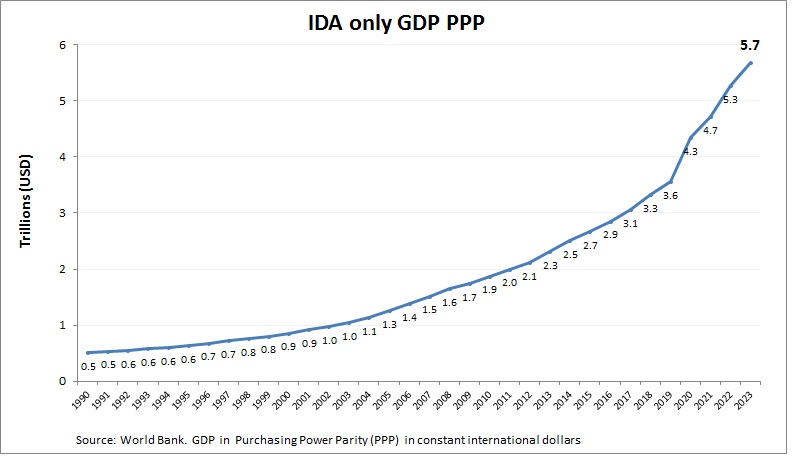
IDA only GDP PPP
IDA only economy graph showing purchasing power parity (PPP) growth from 1990 to today. Purchasing power parity adjusts the size of the economy to relevant price levels, i.e. measuring the price of specific goods in different countries and adjusting GDP View diagram IDA only GDP PPP
Middle income Economy
Middle income economy growth from 2000 to today. GDP (current US$). World Bank and OECD national accounts data. Middle-income economies show growing GDPs with structural transformation from agriculture to services and industry. They often face the “middle-income trap” and work View diagram Middle income Economy
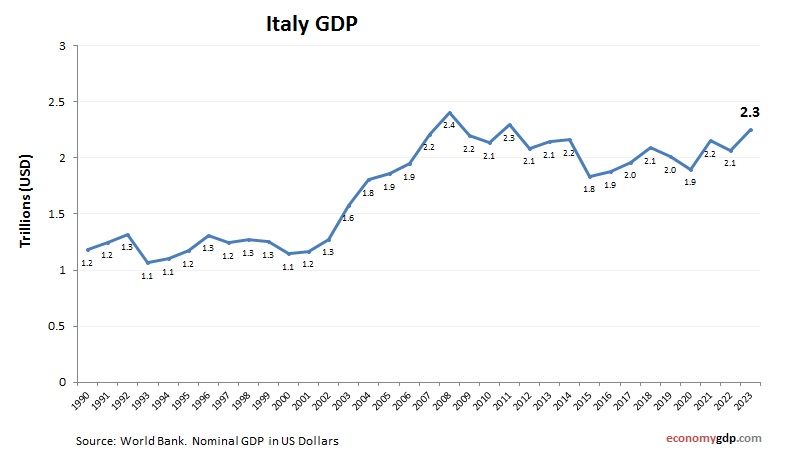
Italy GDP
Italy GDP from 2010 to today. World Bank and OECD data. GDP in US dollars. Italy's GDP is driven by a diverse economy rooted in advanced manufacturing, luxury goods, tourism, and agriculture. Northern regions are highly industrialized, producing automobiles, machinery, View diagram Italy GDP
Level 1 Manage Information Technology
We identified a helpful article on TechBeacon that outlines the eight most important IT service management metrics . Alternatively, if you’re looking for information on the basic concepts of information systems and their applications in management, you might find this View diagram Level 1 Manage Information Technology
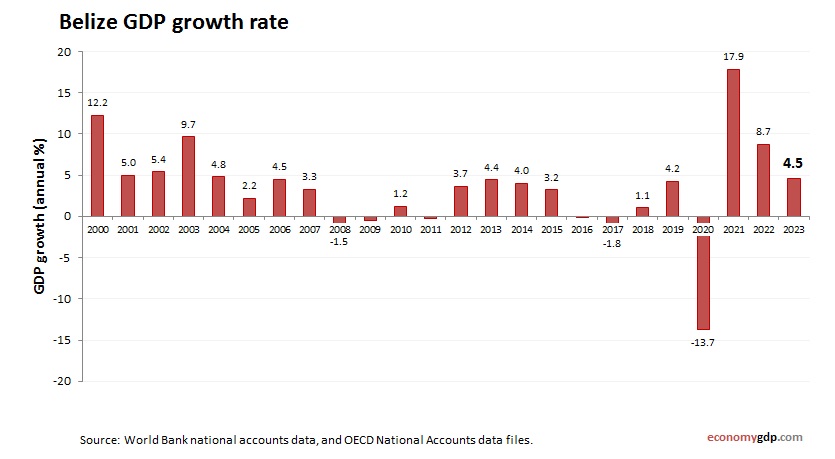
Belize GDP growth rate
Belize economy growth rate from 2000 to today. GDP growth (annual %). World Bank and OECD national accounts data. Belize’s economy is primarily driven by agriculture, tourism, and services. The country is focusing on sustainable development practices and diversification efforts View diagram Belize GDP growth rate
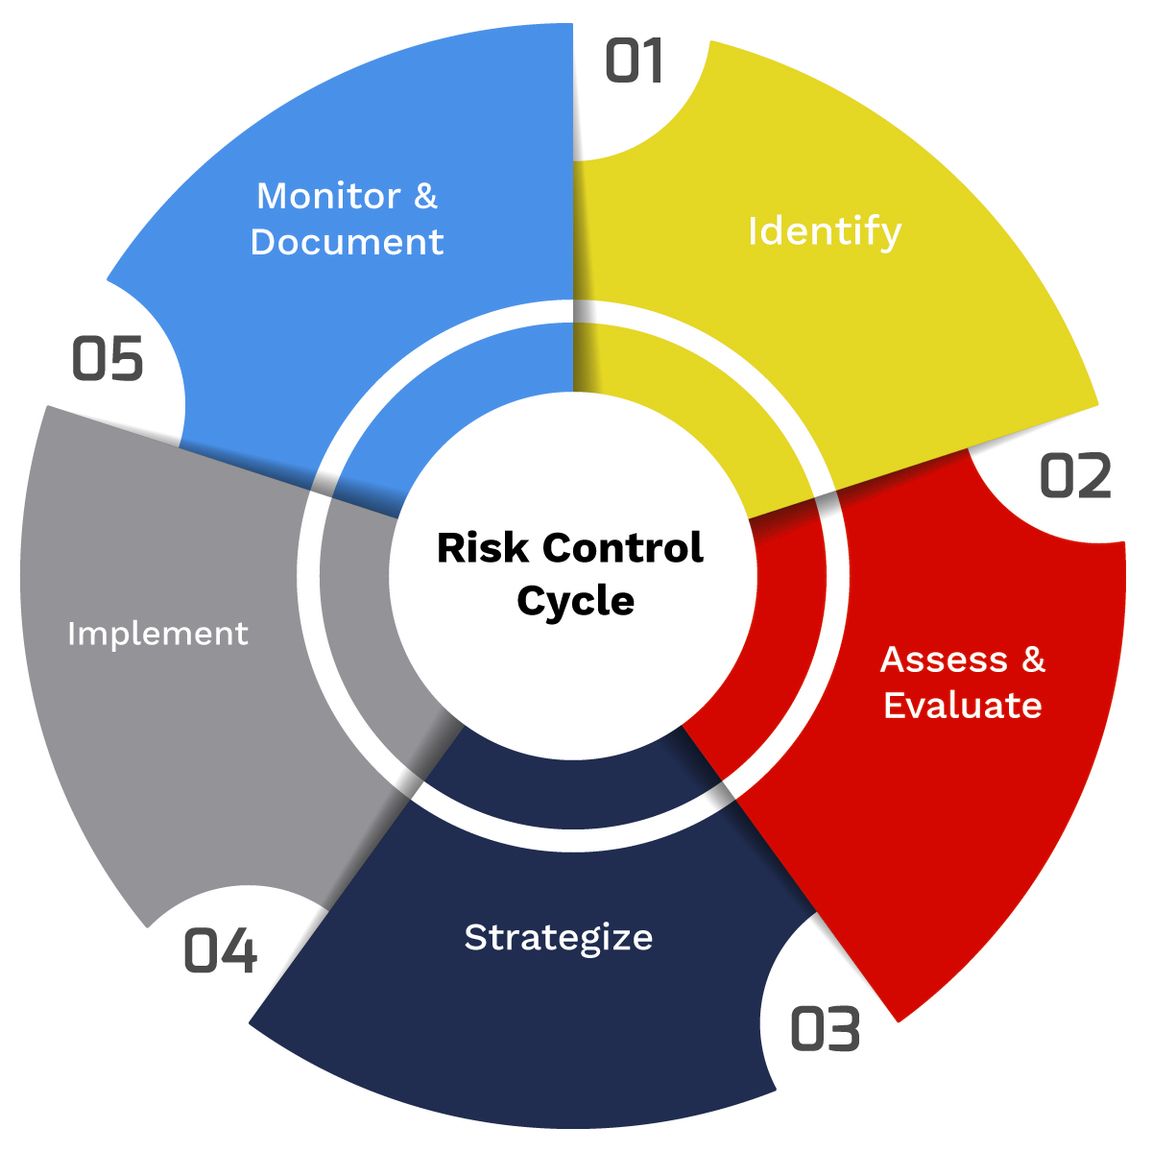
Risk Control Cycle
The risk control cycle is a process that helps firms evaluate potential losses and take action to reduce or eliminate such threats. It is a technique that utilizes findings from risk assessments, which involve identifying potential risk factors in a View diagram Risk Control Cycle