Russia GDP Purchasing Power Parity
Russia economy graph showing purchasing power parity (PPP) growth from 2000 to today. Purchasing power parity adjusts the size of the economy to relevant price levels, i.e. measuring the price of specific goods in different countries and adjusting GDP accordingly. View diagram Russia GDP Purchasing Power Parity
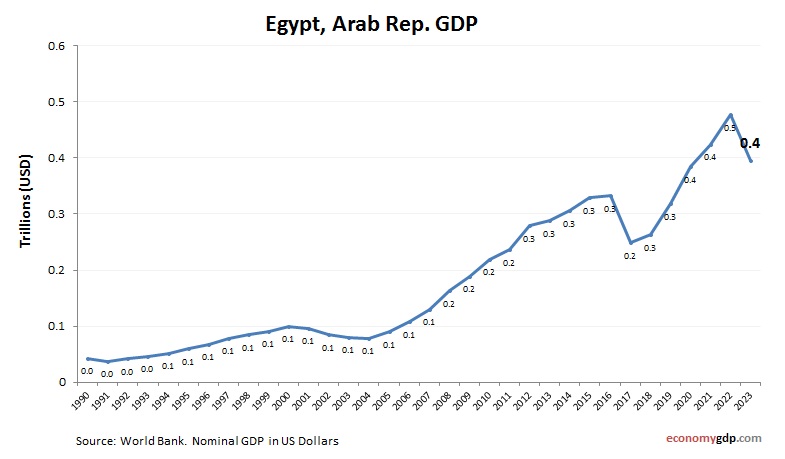
Egypt GDP
Egypt GDP from 2010 to today. World Bank and OECD data. GDP in US dollars. Egypt's robust $404 billion economy, projected to grow 4.0% in 2025, hinges on tourism, Suez Canal revenues, and agriculture, with per capita GDP reaching $3,800. View diagram Egypt GDP
Canada GDP growth rate
Canada economy annual growth rate from 2000 to today. GDP growth (yearly %). World Bank and OECD national accounts data. Canada saw GDP growth of 2.0% in 2023. Energy exports, population growth, and service sector resilience supported the economy, despite View diagram Canada GDP growth rate
Eswatini GDP growth rate
Eswatini economy growth rate from 2000 to today. GDP growth (annual %). World Bank and OECD national accounts data. Eswatini’s economy is based on agriculture, manufacturing, and services. Economic growth has been moderate, with efforts to improve infrastructure and attract View diagram Eswatini GDP growth rate
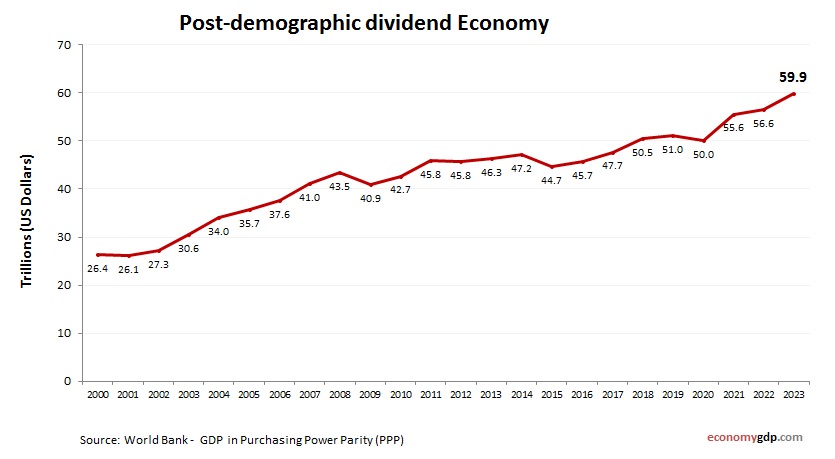
Post-demographic dividend Economy
Post-demographic dividend economy growth from 2000 to today. GDP (current US$). World Bank and OECD national accounts data. These economies have aging populations and shrinking labor forces. GDP growth is driven more by innovation, automation, and productivity improvements than by View diagram Post-demographic dividend Economy
Ireland GDP
Ireland GDP from 2010 to today. World Bank and OECD data. GDP in US dollars. Ireland's knowledge-based economy excels in high-tech, life sciences, and financial services, with a GDP facing slight contraction but expected recovery. Exports, led by chemicals and View diagram Ireland GDP
Middle East and North Africa (IDA and IBRD countries) GDP Purchasing Power Parity
Middle East and North Africa (IDA and IBRD countries) economy graph showing purchasing power parity (PPP) growth from 2000 to today. Purchasing power parity adjusts the size of the economy to relevant price levels, i.e. measuring the price of specific View diagram Middle East and North Africa (IDA and IBRD countries) GDP Purchasing Power Parity
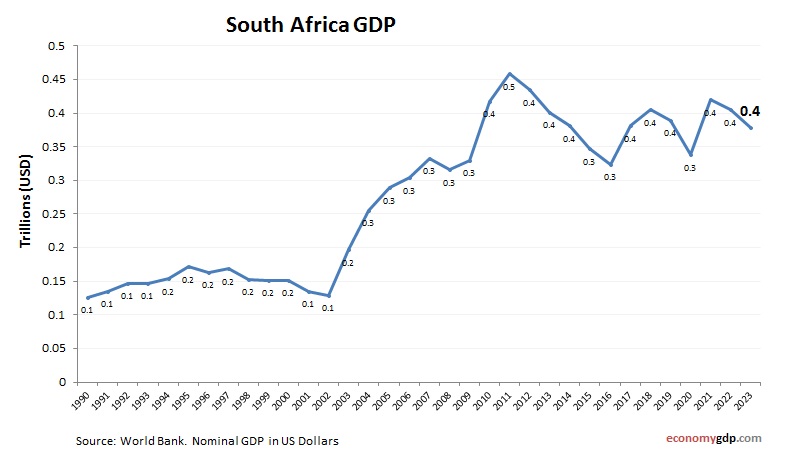
South Africa GDP
South Africa GDP from 2010 to today. World Bank and OECD data. GDP in US dollars. South Africa's economy is the most industrialized in Africa, with GDP driven by mining, manufacturing, agriculture, and services. Gold, platinum, and diamonds remain important View diagram South Africa GDP
Algeria GDP Purchasing Power Parity
Algeria economy graph showing purchasing power parity (PPP) growth from 2000 to today. Purchasing power parity adjusts the size of the economy to relevant price levels, i.e. measuring the price of specific goods in different countries and adjusting GDP accordingly. View diagram Algeria GDP Purchasing Power Parity