
Estonia GDP growth rate

Estonia GDP growth rate

Estonia economy growth rate from 2000 to today. GDP growth (annual %). World Bank and OECD national accounts data. Estonia has a highly digitalized economy, with strengths in information technology, manufacturing, and services. Economic growth has been steady, supported by View diagram Estonia GDP growth rate→

Hungary GDP growth rate

Hungary GDP growth rate

Hungary economy growth rate from 2000 to today. GDP growth (annual %). World Bank and OECD national accounts data. Hungary’s economy showed signs of recovery, with growth driven by domestic consumption and exports. Inflation and public debt remain key challenges.

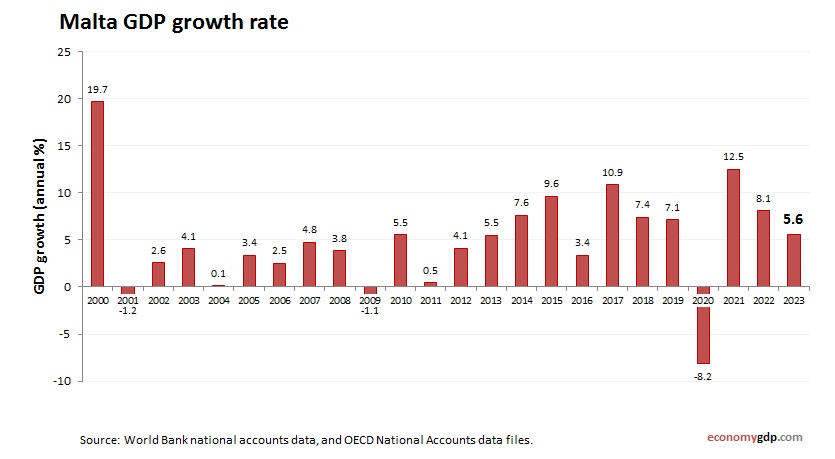
Malta GDP growth rate

Malta GDP growth rate

Malta economy growth rate from 2000 to today. GDP growth (annual %). World Bank and OECD national accounts data. Malta’s economy has shown steady growth, supported by strong domestic demand and export performance. The country benefits from a robust tourism View diagram Malta GDP growth rate→

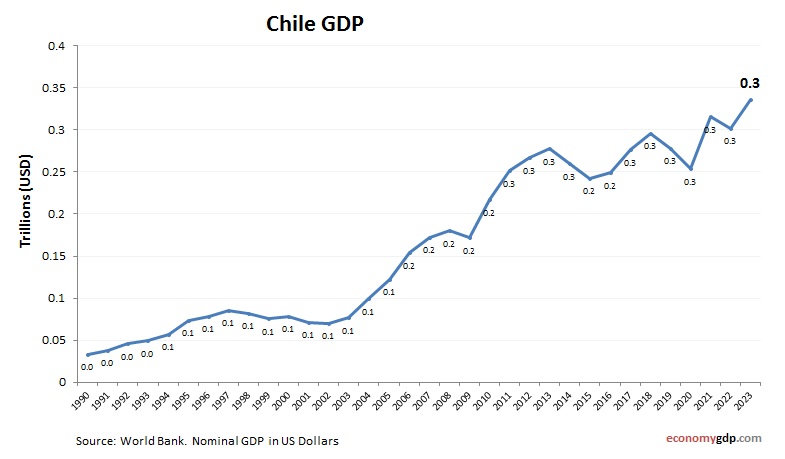
Chile GDP

Chile GDP

Chile GDP from 2010 to today. World Bank and OECD data. GDP in US dollars. Chile's $330 billion economy, growing 2.4% in 2025, excels in copper, wine, and salmon exports, with per capita GDP at $17,000. Copper dominates trade, while View diagram Chile GDP→

Panama GDP growth rate

Panama GDP growth rate

Panama economy growth rate from 2000 to today. GDP growth (annual %). World Bank and OECD national accounts data. Panama’s economy benefits from its strategic location and the Panama Canal, with growth driven by logistics, finance, and services sectors. The View diagram Panama GDP growth rate→

Fragile and conflict affected situations GDP Purchasing Power Parity

Fragile and conflict affected situations GDP Purchasing Power Parity

Fragile and conflict affected situations economy graph showing purchasing power parity (PPP) growth from 2000 to today. Purchasing power parity adjusts the size of the economy to relevant price levels, i.e. measuring the price of specific goods in different countries View diagram Fragile and conflict affected situations GDP Purchasing Power Parity→