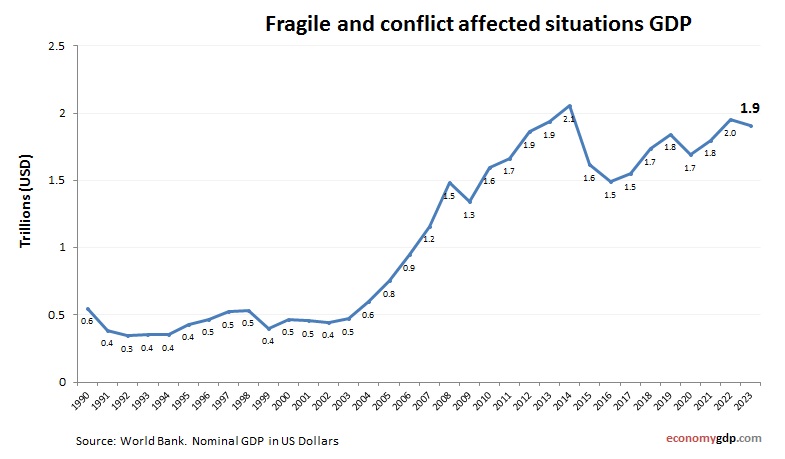
Fragile and conflict affected situations GDP per capita
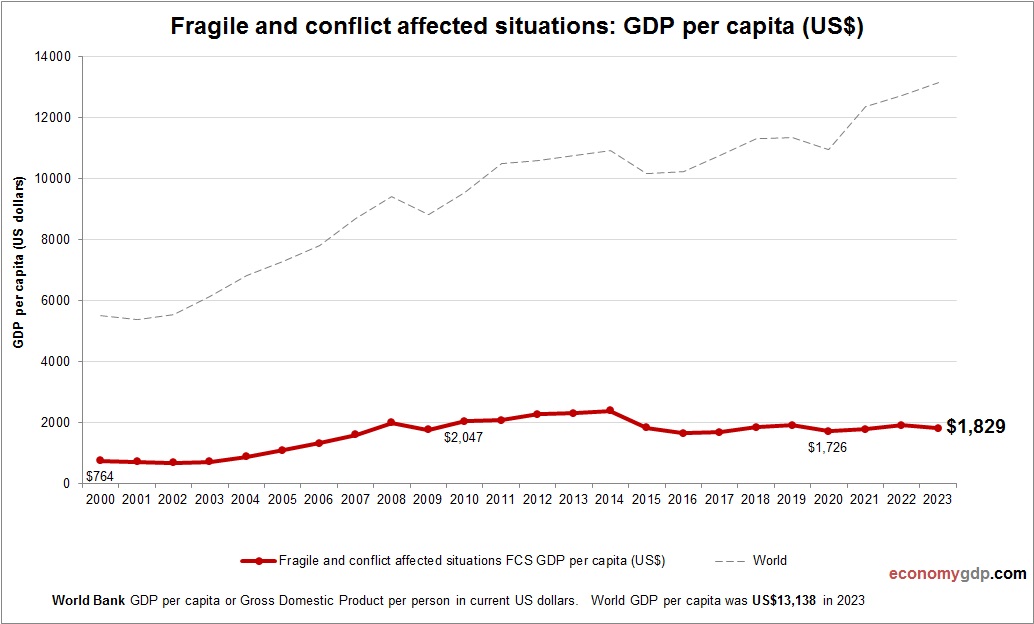
This graph shows Fragile and conflict affected situations GDP per capita. The economic data is provided by World Bank. Latest GDP per person information for Fragile and conflict affected situations. Countries classified under fragile and conflict-affected situations typically exhibit low View diagram Fragile and conflict affected situations GDP per capita