Chile Inflation

Chile Inflation

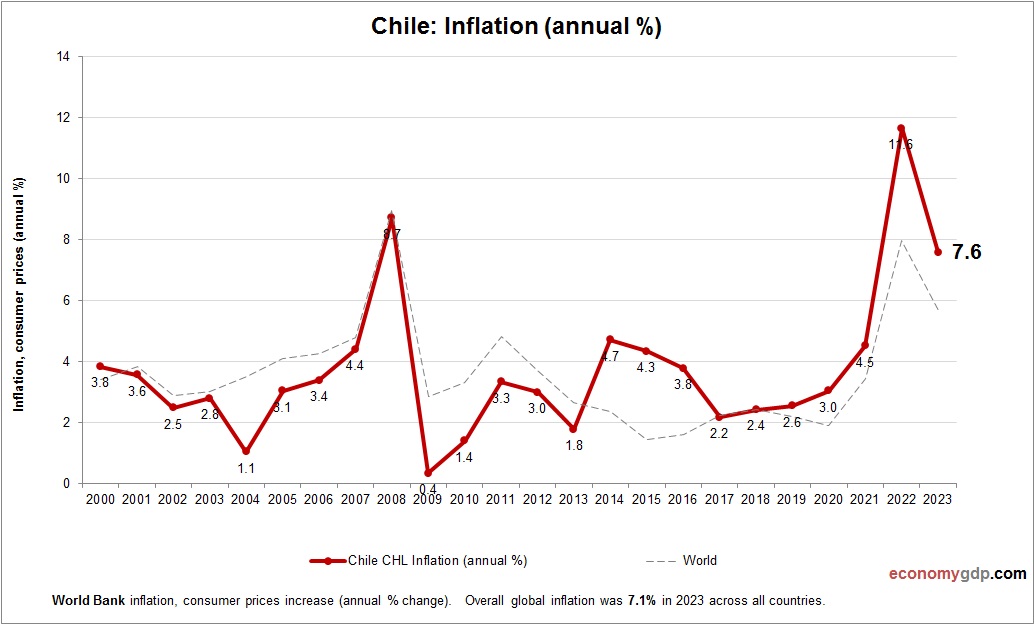
This diagram presents Chile Inflation. The consumer price statistics are compiled by World Bank. Based on the latest economic data provided for Chile. Chile’s inflation stems from increased energy and food prices, currency depreciation, and strong post-pandemic consumer demand, prompting View diagram Chile Inflation

Chile GDP

Chile GDP

Chile GDP from 2010 to today. World Bank and OECD data. GDP in US dollars. Chile's $330 billion economy, growing 2.4% in 2025, excels in copper, wine, and salmon exports, with per capita GDP at $17,000. Copper dominates trade, while View diagram Chile GDP

Chile GDP PPP

Chile GDP PPP

Chile economy graph showing purchasing power parity (PPP) growth from 2000 to today. Purchasing power parity adjusts the size of the economy to relevant price levels, i.e. measuring the price of specific goods in different countries and adjusting GDP accordingly. View diagram Chile GDP PPP