Skip to content
cropped-economygdp.jpg

Economy GDP

World economy charts, business frameworks and diagrams

Menu

Primary menu

  • Economy
    • Top Economies
  • Demographics
  • Business
    • Strategy
    • Project Management
    • Industry Examples
    • Leadership
    • HR
    • Industry Examples
  • Framework
  • Analysis
  • Lean Six Sigma
    • Lean
  • IT
    • Social Media
  • Marketing
  • Stories
  • Top

Haiti Children Per woman

Haiti Children Per woman

The above graph shows Haiti Children Per woman. World Bank is the source of this birth data. Based on the latest demographics info provided for Haiti. Haitian women tend to have around three to four children, influenced by economic hardship, View diagram Haiti Children Per woman→

Posted in Demographics | Tagged Haiti demographics, Haiti statistics

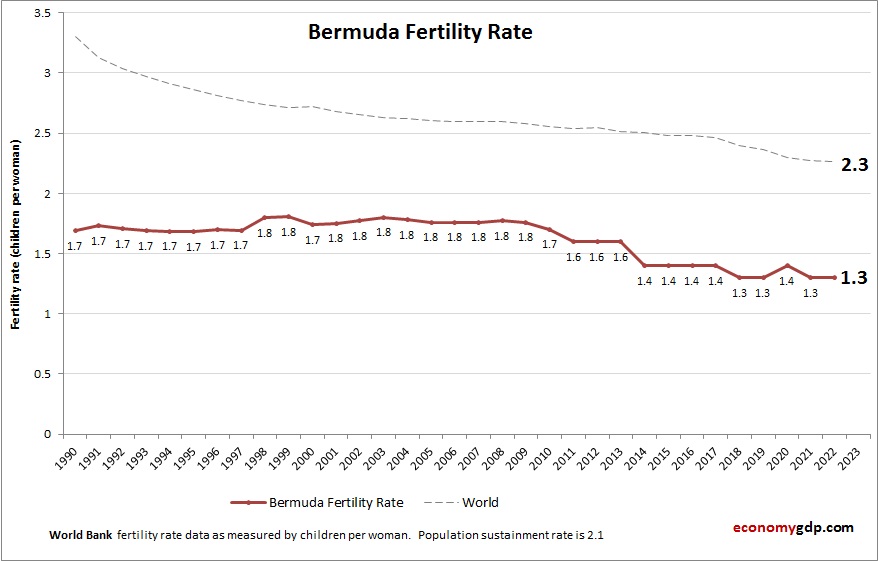
Bermuda Fertility Rate

Bermuda Fertility Rate

The above graph shows Bermuda Fertility Rate. This is according to World Bank birth stats by country. Based on the latest demographics info provided for Bermuda. Bermuda’s fertility rate is low to moderate, affected by urban lifestyles and economic conditions. View diagram Bermuda Fertility Rate→

Posted in Demographics | Tagged Bermuda demographics, Bermuda statistics

South Sudan Children Per woman

South Sudan Children Per woman

Chart above demonstrates South Sudan Children Per woman. World Bank is the source of this birth data. Based on the latest available information for South Sudan. South Sudan has one of the highest children per woman rates in the world. View diagram South Sudan Children Per woman→

Posted in Demographics | Tagged South Sudan demographics, South Sudan statistics

Guinea-Bissau Fertility Rate

Guinea-Bissau Fertility Rate

This diagram presents Guinea-Bissau Fertility Rate. World Bank is the source of this birth data. Based on the latest available information for Guinea-Bissau. Guinea-Bissau maintains a high fertility rate. Traditional values, limited healthcare infrastructure, and low access to education continue View diagram Guinea-Bissau Fertility Rate→

Posted in Demographics | Tagged Guinea-Bissau statistics

Bhutan Fertility Rate

Bhutan Fertility Rate

The above graph shows Bhutan Fertility Rate. World Bank is the source of this birth data. Based on the latest demographics info provided for Bhutan. Bhutan’s fertility rate is moderate and slowly declining. Socioeconomic development and increased female education influence View diagram Bhutan Fertility Rate→

Posted in Demographics | Tagged Bhutan demographics, Bhutan statistics

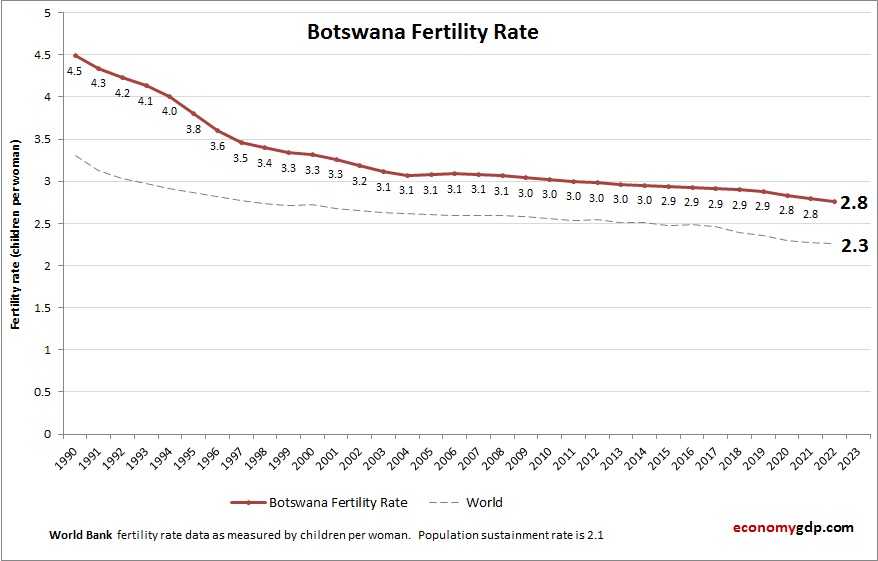
Botswana Fertility Rate

Botswana Fertility Rate

The above graph shows Botswana Fertility Rate. The fertility rate statistics are compiled by World Bank. Based on the latest available information for Botswana. Botswana’s fertility rate is moderate and declining. Improved access to contraception and urbanization contribute to falling View diagram Botswana Fertility Rate→

Posted in Demographics | Tagged Botswana demographics, Botswana statistics

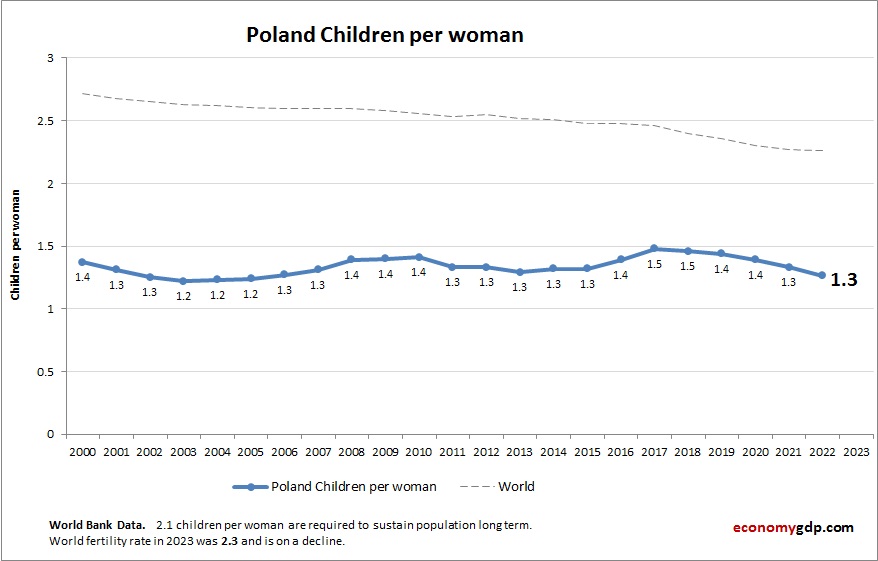
Poland Children Per woman

Poland Children Per woman

The above graph shows Poland Children Per woman. This is according to World Bank birth stats by country. Based on the latest demographics info provided for Poland. Polish women have fewer than two children on average, reflecting low fertility trends View diagram Poland Children Per woman→

Posted in Demographics | Tagged Poland demographics, Poland statistics

Monaco Children Per woman

Monaco Children Per woman

This diagram presents Monaco Children Per woman. World Bank is the source of this birth data. Based on the latest available information for Monaco. Monaco has one of the lowest children per woman rates. A wealthy, urbanized population and high View diagram Monaco Children Per woman→

Posted in Demographics | Tagged Monaco demographics, Monaco statistics

Turkmenistan Fertility Rate

Turkmenistan Fertility Rate

Chart above demonstrates Turkmenistan Fertility Rate. The fertility rate statistics are compiled by World Bank. Based on the latest demographics info provided for Turkmenistan. Turkmenistan has a moderate fertility rate, balancing traditional values with modern healthcare access. See detailed Turkmenistan View diagram Turkmenistan Fertility Rate→

Posted in Demographics | Tagged Turkmenistan demographics, Turkmenistan statistics

Nigeria Fertility Rate

Nigeria Fertility Rate

This diagram presents Nigeria Fertility Rate. World Bank is the source of this birth data. Based on the latest demographics info provided for Nigeria. Nigeria’s fertility rate remains high, driven by cultural factors and limited access to contraception despite ongoing View diagram Nigeria Fertility Rate→

Posted in Demographics | Tagged Nigeria demographics, Nigeria statistics

Post navigation

← Older posts
Newer posts →

Primary Sidebar Widget Area

Top Diagrams

Latest Posts

  • Ways to Make Money Fast Illustration
  • Business Model Framework Sample
  • North America Children Per woman
  • Turkey’s Economy – A $1.6 Trillion Economy That Can’t Shake Inflation
  • Mozambique Economy
  • Bulgaria Inflation
  • Saudi Arabia’s Economy – The Oil Giant Trying to Outgrow Oil
  • Suriname Children Per woman
  • Architecture Diagram for Salesforce Trailhead
  • Switzerland’s Economy – Small Country, Enormous Paycheck
  • Zambia GDP
  • Liechtenstein GDP PPP
  • Turkmenistan Economy
  • Netherlands Economy – European Logistics Hub
  • Somalia Inflation
  • Twitter
Copyright © 2026 Economy GDP. All Rights Reserved.
Theme: Catch Box by Catch Themes
Scroll Up