Skip to content
cropped-economygdp.jpg

Economy GDP

World economy charts, business frameworks and diagrams

Menu

Primary menu

  • Economy
    • Top Economies
  • Demographics
  • Business
    • Strategy
    • Project Management
    • Industry Examples
    • Leadership
    • HR
    • Industry Examples
  • Framework
  • Analysis
  • Lean Six Sigma
    • Lean
  • IT
    • Social Media
  • Marketing
  • Stories
  • Top

Tag Archives: Poland statistics

Poland Children Per woman

Poland Children Per woman

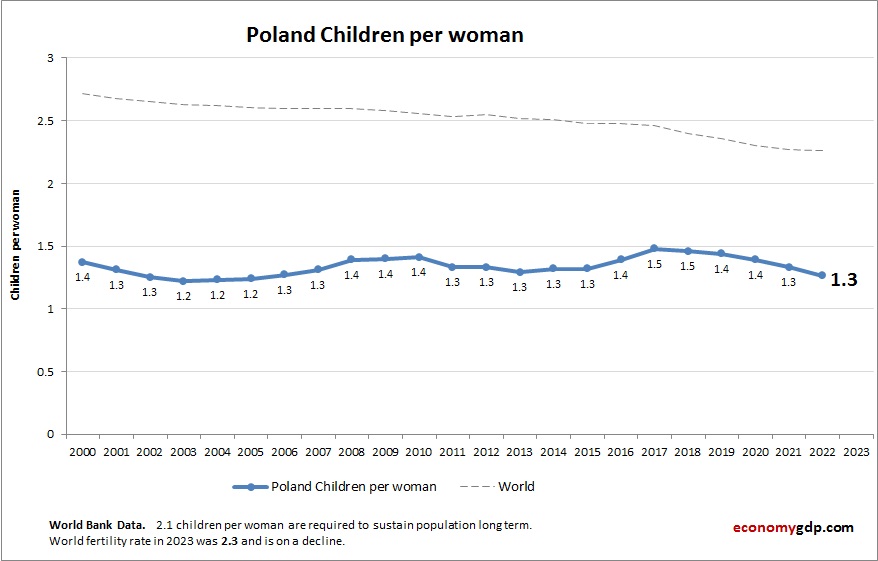
The above graph shows Poland Children Per woman. This is according to World Bank birth stats by country. Based on the latest demographics info provided for Poland. Polish women have fewer than two children on average, reflecting low fertility trends View diagram Poland Children Per woman→

Posted in Demographics | Tagged Poland demographics, Poland statistics

Poland GDP Purchasing Power Parity

Poland GDP Purchasing Power Parity

Poland economy graph showing purchasing power parity (PPP) growth from 2000 to today. Purchasing power parity adjusts the size of the economy to relevant price levels, i.e. measuring the price of specific goods in different countries and adjusting GDP accordingly. View diagram Poland GDP Purchasing Power Parity→

Posted in Economy | Tagged Poland, Poland economy, Poland gdp, Poland statistics

Primary Sidebar Widget Area

Top Diagrams

Latest Posts

  • Togo Economy
  • Qatar Fertility Rate
  • Puerto Rico GDP PPP
  • Honduras GDP Purchasing Power Parity
  • Curacao GDP
  • Fertility Rate
  • Steps in Agile Methodology Clarified
  • Botswana GDP Purchasing Power Parity
  • Ecuador Inflation
  • Porter Diamond Model Strategy
  • Liberia GDP
  • Customer Experience Management Model
  • Paraguay Economy
  • Arab World GDP per capita
  • Israel Children Per woman
  • Twitter
Copyright © 2026 Economy GDP. All Rights Reserved.
Theme: Catch Box by Catch Themes
Scroll Up