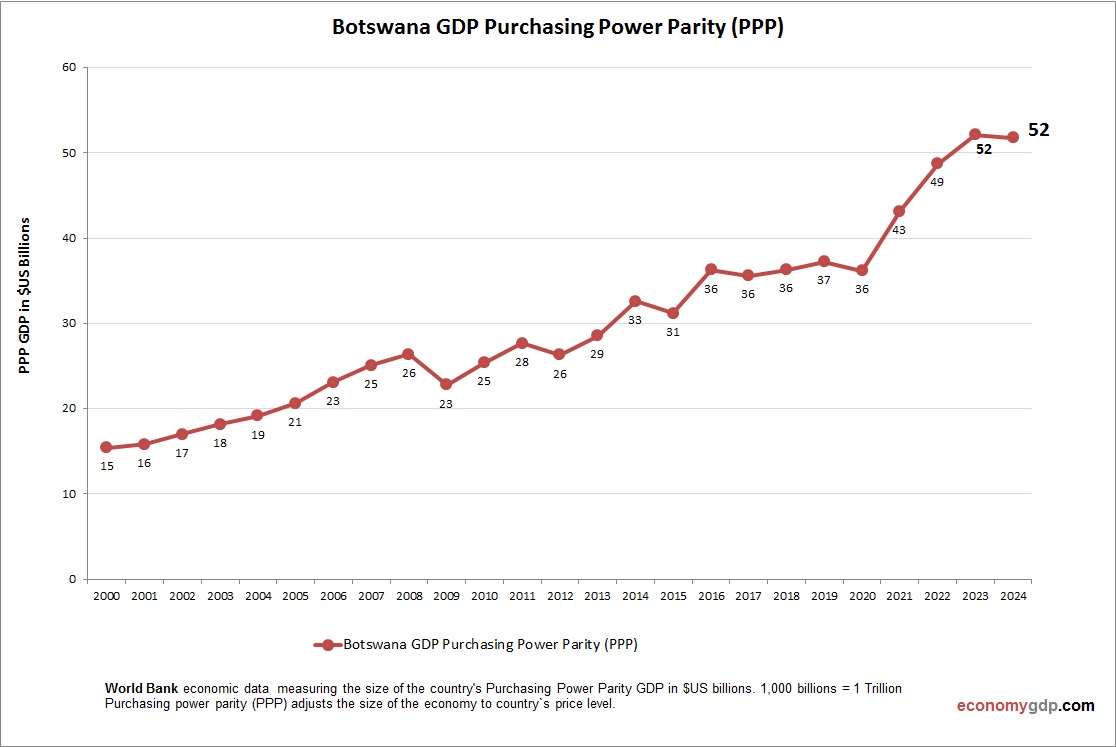
Botswana GDP Purchasing Power Parity
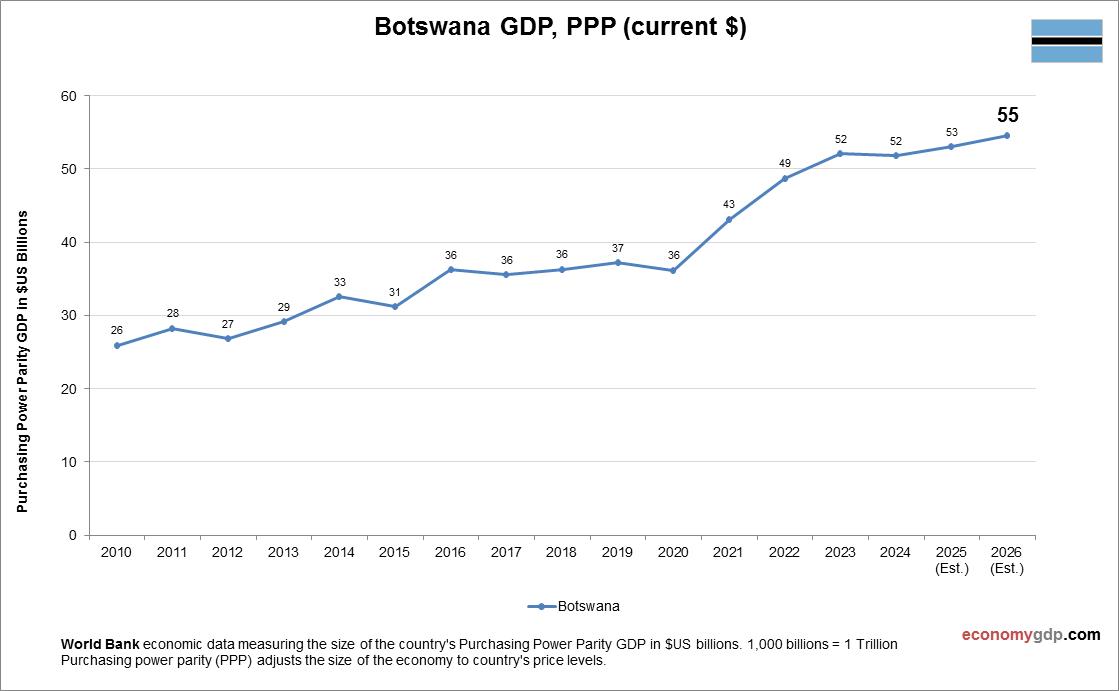
Botswanas GDP (PPP) is projected at $51.6 billion in 2025. Diamonds dominate Botswanas economy, accounting for a significant share of GDP and exports. The PPP adjustment reflects a moderate cost of living, increasing GDP relative to nominal values. Stable governance View diagram Botswana GDP Purchasing Power Parity