Skip to content
cropped-economygdp.jpg

Economy GDP

World economy charts, business frameworks and diagrams

Menu

Primary menu

  • Economy
    • Top Economies
  • Demographics
  • Business
    • Strategy
    • Project Management
    • Industry Examples
    • Leadership
    • HR
    • Industry Examples
  • Framework
  • Analysis
  • Lean Six Sigma
    • Lean
  • IT
    • Social Media
  • Marketing
  • Stories
  • Top

Netherlands Fertility Rate

Netherlands Fertility Rate

The above graph shows Netherlands Fertility Rate. World Bank is the source of this birth data. Based on the latest demographics info provided for Netherlands. The Netherlands has a low fertility rate. Though supported by strong family benefits, lifestyle choices View diagram Netherlands Fertility Rate→

Posted in Demographics | Tagged Netherlands demographics, Netherlands statistics

Africa Eastern and Southern GDP per capita

Africa Eastern and Southern GDP per capita

This graph shows Africa Eastern and Southern GDP per capita. This is according to World Bank GDP stats by country. Latest GDP per person information for Africa Eastern and Southern. The Eastern and Southern regions of Africa encompass a diverse View diagram Africa Eastern and Southern GDP per capita→

Posted in Economy | Tagged Africa Eastern and Southern economy

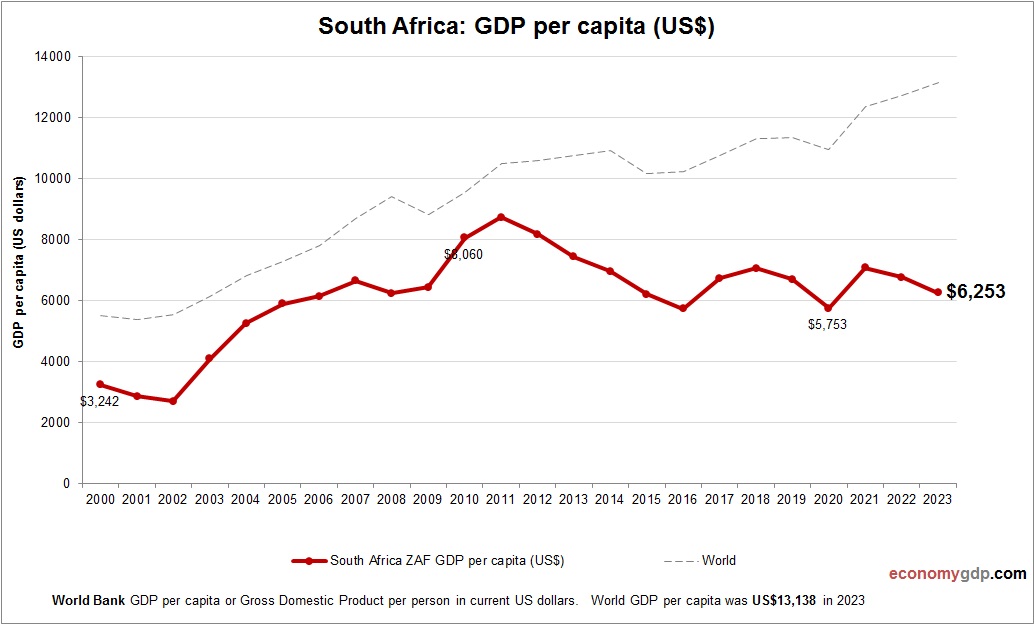
South Africa GDP per capita

South Africa GDP per capita

This graph shows South Africa GDP per capita. The gross domestic product statistics are compiled by World Bank. Based on the latest economic info provided for South Africa. South Africa’s GDP per capita in 2024 is projected at around $7,500. View diagram South Africa GDP per capita→

Posted in Economy | Tagged South Africa economy, South Africa statistics

St. Vincent and the Grenadines Inflation

St. Vincent and the Grenadines Inflation

This chart demonstrates St. Vincent and the Grenadines Inflation. The consumer price statistics are compiled by World Bank. Based on the latest available information for St. Vincent and the Grenadines. Inflation here is driven by food and fuel import prices, View diagram St. Vincent and the Grenadines Inflation→

Posted in Economy | Tagged St. Vincent and the Grenadines economy, St. Vincent and the Grenadines statistics

Eritrea Children Per woman

Eritrea Children Per woman

The above graph shows Eritrea Children Per woman. World Bank is the source of this birth data. Latest births per woman information for Eritrea. Eritrea has a relatively high children per woman rate, though it is slowly declining. Persistent rural View diagram Eritrea Children Per woman→

Posted in Demographics

Libya GDP per capita

Libya GDP per capita

This diagram presents Libya GDP per capita. This is according to World Bank GDP stats by country. Based on the latest available information for Libya. Libya’s GDP per capita in 2024 is projected to be around $8,000. The economy is View diagram Libya GDP per capita→

Posted in Economy | Tagged Libya statistics

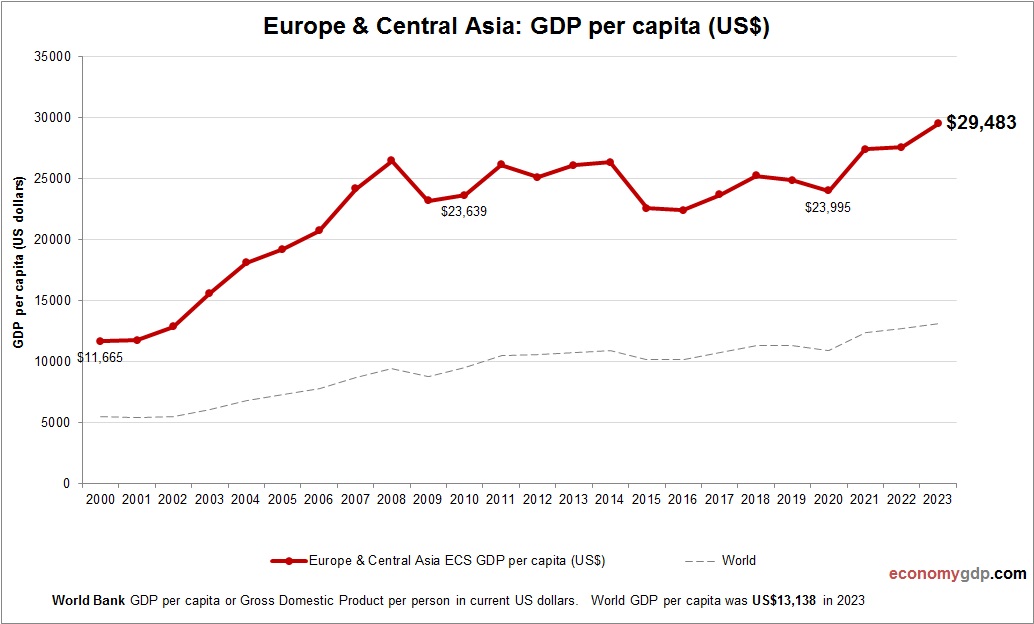
Europe & Central Asia GDP per capita

Europe & Central Asia GDP per capita

This chart demonstrates Europe & Central Asia GDP per capita. The economic data is provided by World Bank. Based on the latest available information for Europe & Central Asia. The Europe & Central Asia region displays a wide range of View diagram Europe & Central Asia GDP per capita→

Posted in Economy | Tagged Europe & Central Asia economy, Europe & Central Asia statistics

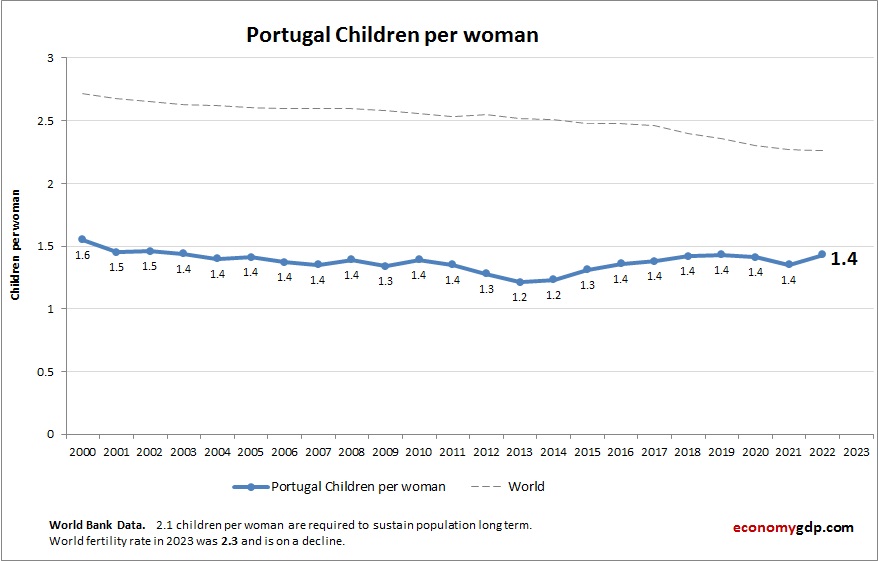
Portugal Children Per woman

Portugal Children Per woman

Chart above demonstrates Portugal Children Per woman. The fertility rate statistics are compiled by World Bank. Latest births per woman information for Portugal. Portuguese women have fewer than two children on average, due to economic uncertainties and social changes that View diagram Portugal Children Per woman→

Posted in Demographics | Tagged Portugal demographics, Portugal statistics

Slovenia Children Per woman

Slovenia Children Per woman

This diagram presents Slovenia Children Per woman. The fertility rate statistics are compiled by World Bank. Latest births per woman information for Slovenia. Slovenia’s children per woman rate is low. Socioeconomic stability, modern lifestyle choices, and support for work-life balance View diagram Slovenia Children Per woman→

Posted in Demographics | Tagged Slovenia demographics, Slovenia statistics

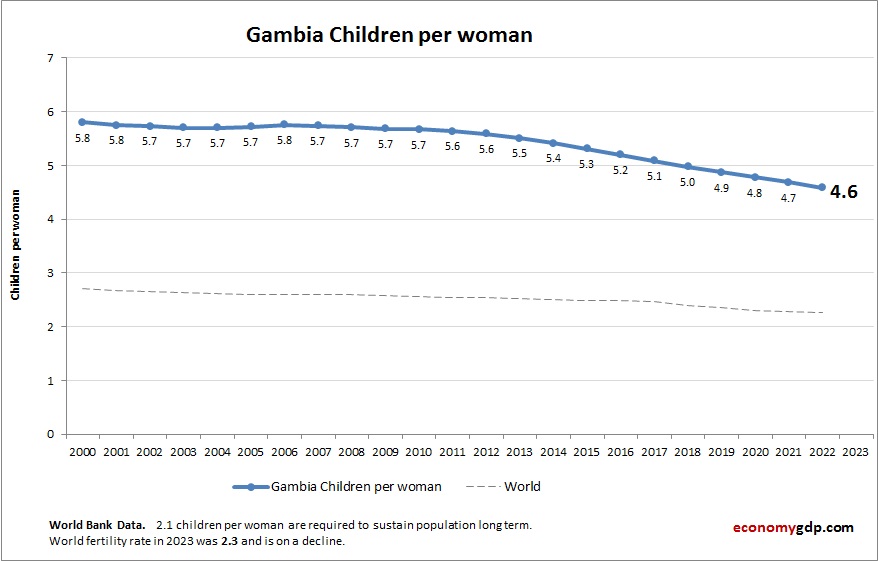
Gambia Children Per woman

Gambia Children Per woman

The above graph shows Gambia Children Per woman. World Bank is the source of this birth data. Latest births per woman information for Gambia. Gambia has a high children per woman rate. Rural traditions, low contraceptive use, and limited healthcare View diagram Gambia Children Per woman→

Posted in Demographics | Tagged Gambia demographics, Gambia statistics

Post navigation

← Older posts
Newer posts →

Primary Sidebar Widget Area

Top Diagrams

Latest Posts

  • Business Model Framework Sample
  • North America Children Per woman
  • Turkey’s Economy – A $1.6 Trillion Economy That Can’t Shake Inflation
  • Mozambique Economy
  • Bulgaria Inflation
  • Saudi Arabia’s Economy – The Oil Giant Trying to Outgrow Oil
  • Suriname Children Per woman
  • Architecture Diagram for Salesforce Trailhead
  • Switzerland’s Economy – Small Country, Enormous Paycheck
  • Zambia GDP
  • Liechtenstein GDP PPP
  • Turkmenistan Economy
  • Netherlands Economy – European Logistics Hub
  • Somalia Inflation
  • Best Business Model Diagrams
  • Twitter
Copyright © 2026 Economy GDP. All Rights Reserved.
Theme: Catch Box by Catch Themes
Scroll Up