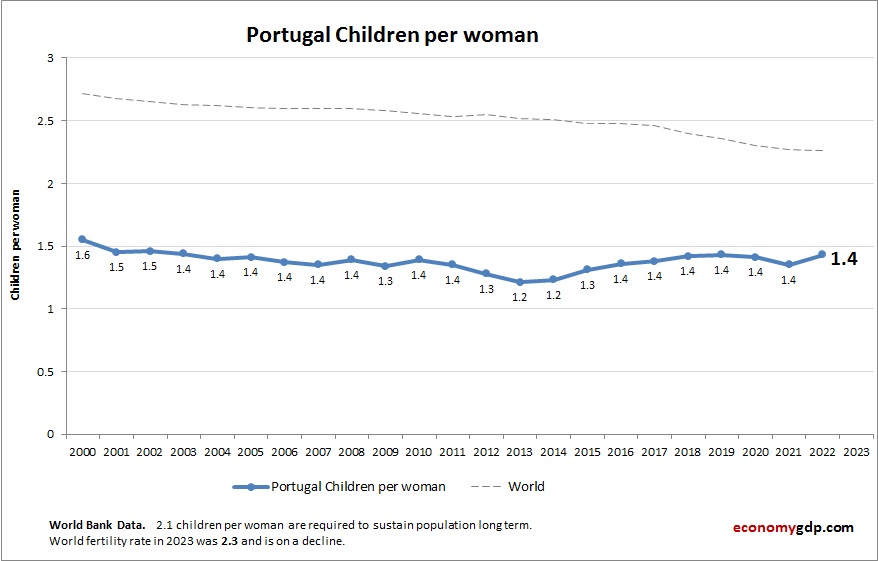
Portugal Fertility Rate
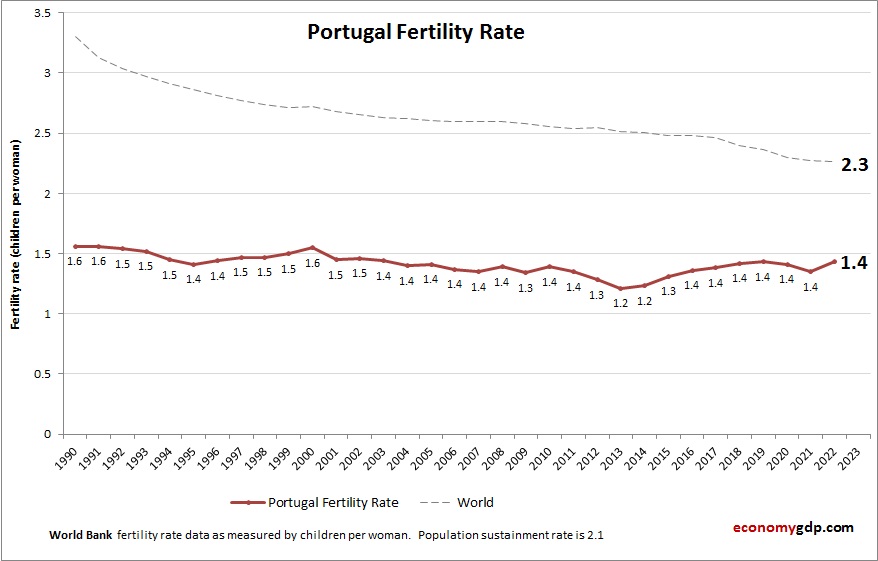
The above graph shows Portugal Fertility Rate. The fertility rate statistics are compiled by World Bank. Based on the latest available information for Portugal. Portugals fertility rate is very low, influenced by economic uncertainty and social changes that delay childbearing. View diagram Portugal Fertility Rate