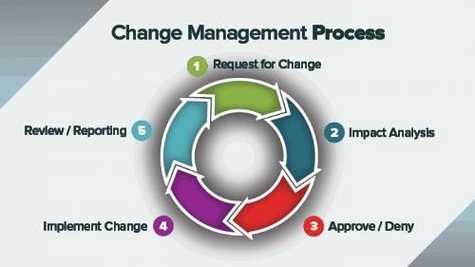
IT Change Management Process Illustration

IT Change Management Process Illustration

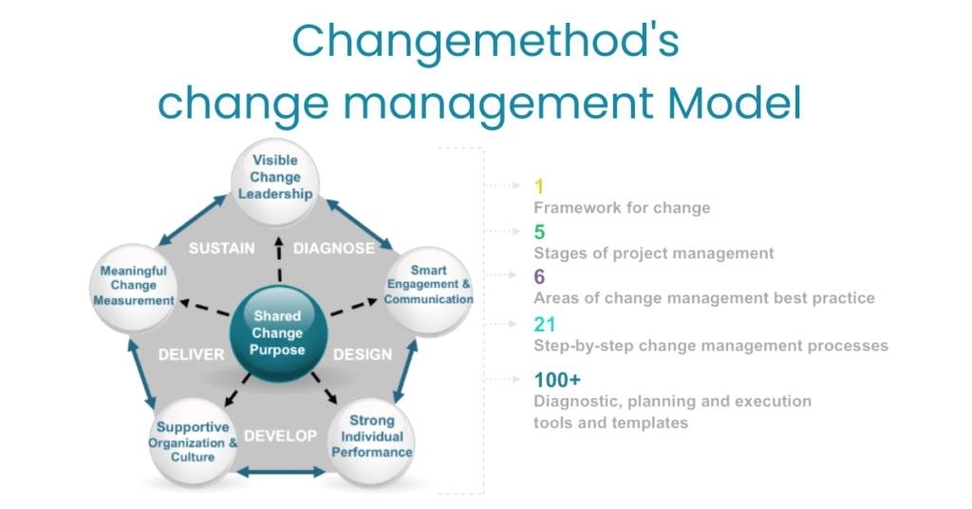
IT Change Management Process Illustration: The IT change management process illustration is a visual representation that depicts the steps and flow involved in managing IT changes within an organization. This illustration typically includes stages such as change request, assessment, approval, View diagram IT Change Management Process Illustration→

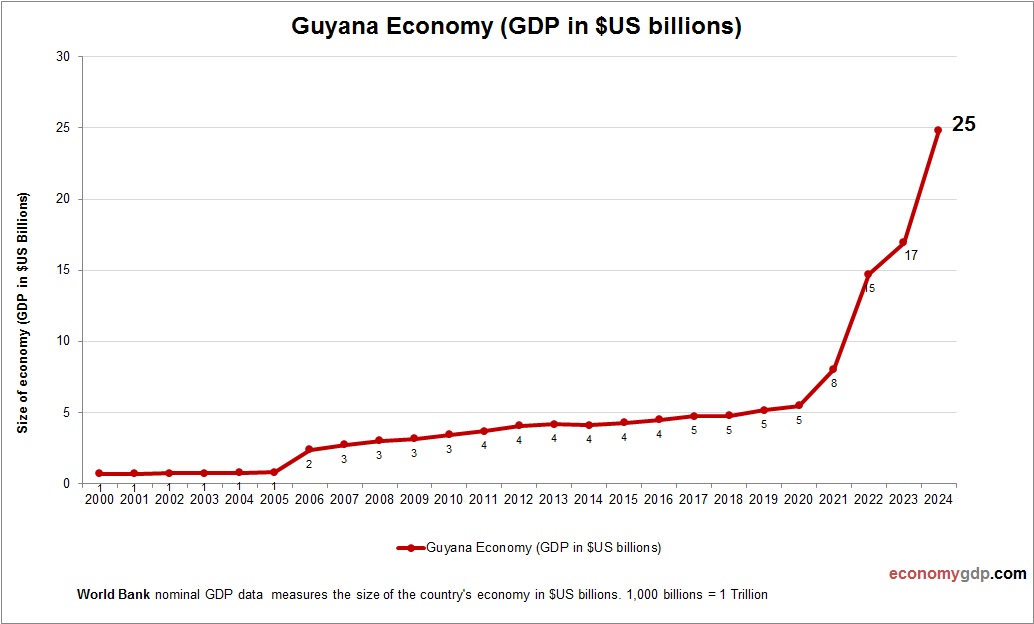
Guyana Economy

Guyana Economy

Guyana's economy has transformed with massive oil discoveries, boosting GDP through exports via ExxonMobil partnerships. Traditionally agrarian, it produces rice, sugar, and bauxite. Forestry and gold mining contribute, while eco-tourism leverages rainforests and Kaieteur Falls. Rapid oil revenue influx funds View diagram Guyana Economy→

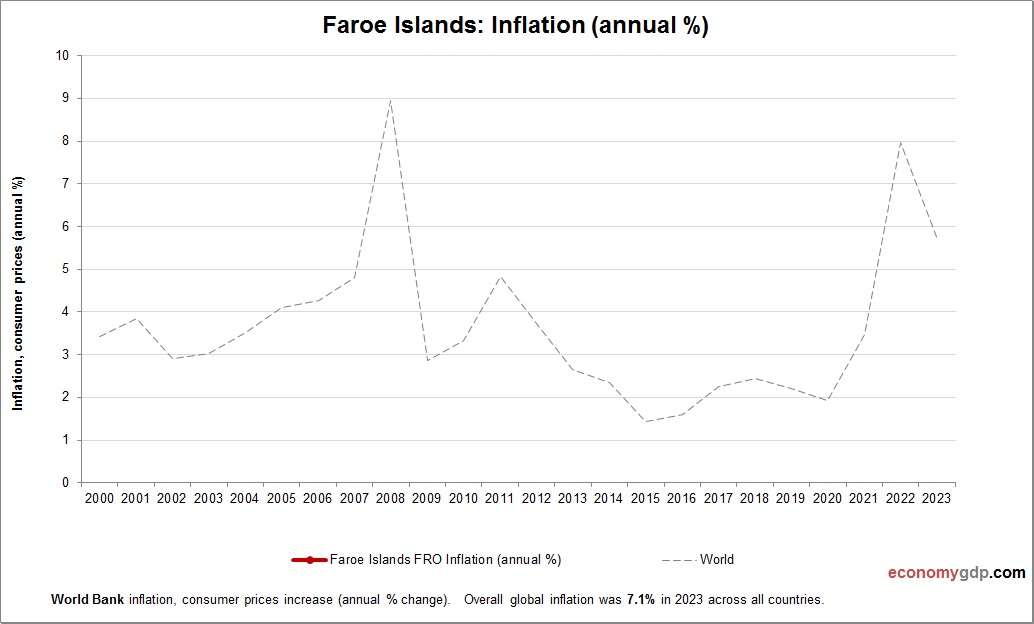
Faroe Islands Inflation

Faroe Islands Inflation

This diagram presents Faroe Islands Inflation. The consumer price statistics are compiled by World Bank. Change in consumer prices for Faroe Islands. The Faroe Islands experience inflation primarily from imported food and energy costs, with limited domestic production to buffer View diagram Faroe Islands Inflation→

Effective Change Management Process Described

Effective Change Management Process Described

Effective Change Management Process Described: An effective change management process is a structured approach to transitioning individuals, teams, and organizations from a current state to a desired future state. The process includes assessing the need for change, planning and communicating View diagram Effective Change Management Process Described→