
Zimbabwe Fertility Rate

World economy charts, business frameworks and diagrams
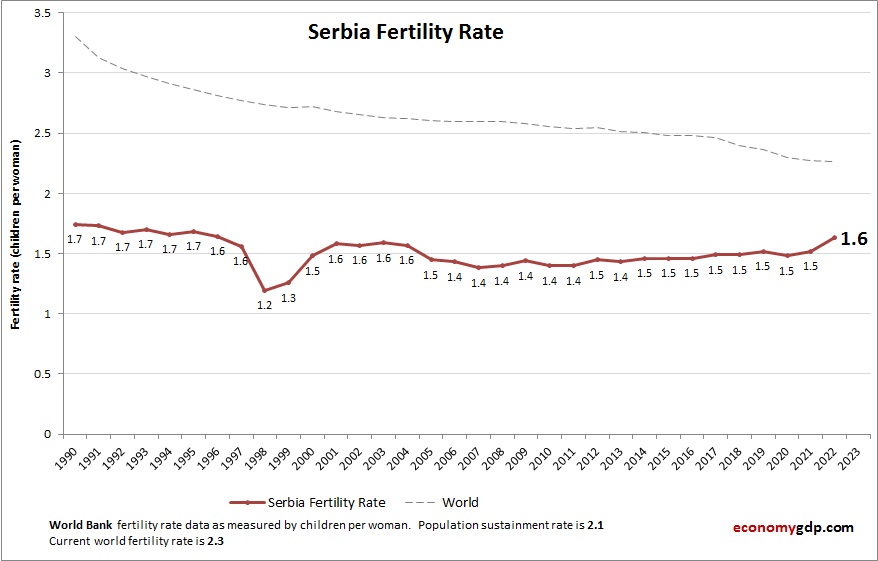
Chart above demonstrates Serbia Fertility Rate. The fertility rate statistics are compiled by World Bank. Latest births per woman information for Serbia. Serbias fertility rate is below replacement level, affected by economic challenges, emigration, and delayed family formation. See detailed View diagram Serbia Fertility Rate

Trinidad and Tobago's high-income economy, the Caribbean's wealthiest, projects steady GDP growth. Petroleum, petrochemicals, and gas dominate, with agriculture and services playing smaller roles. Exports like LNG and methanol are significant, while imports include fuels and machinery. Challenges involve energy View diagram Trinidad and Tobago GDP
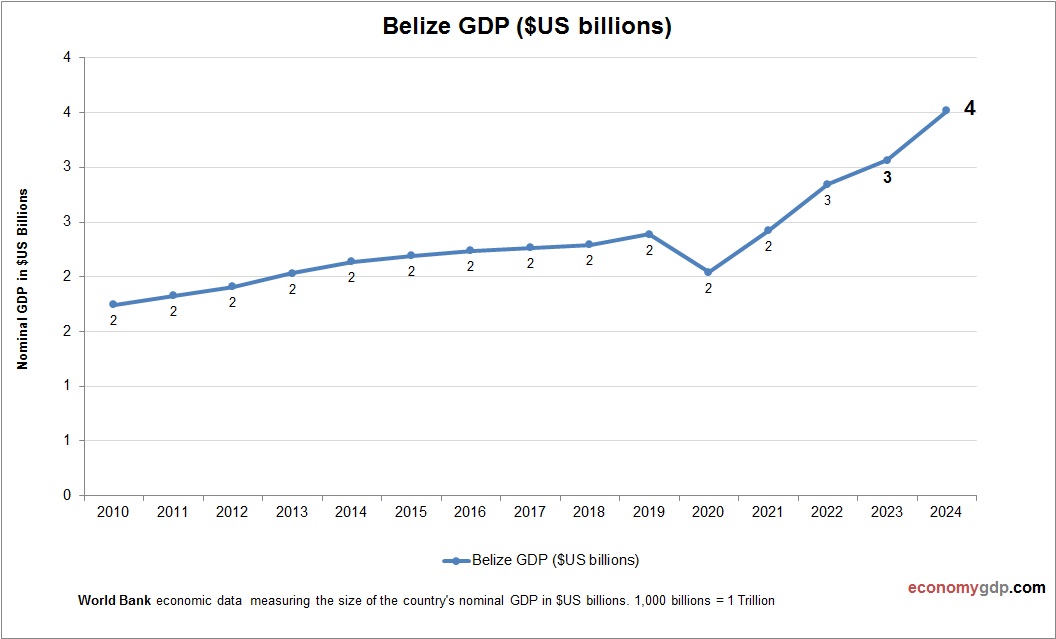
Belize's economy, driven by agriculture, tourism, and services, projects moderate growth with a per capita GDP of $8,650. Exports like sugar, bananas, and fish contrast with imports of fuel, creating trade deficits. High poverty and unemployment persist, alongside labor shortages. View diagram Belize GDP
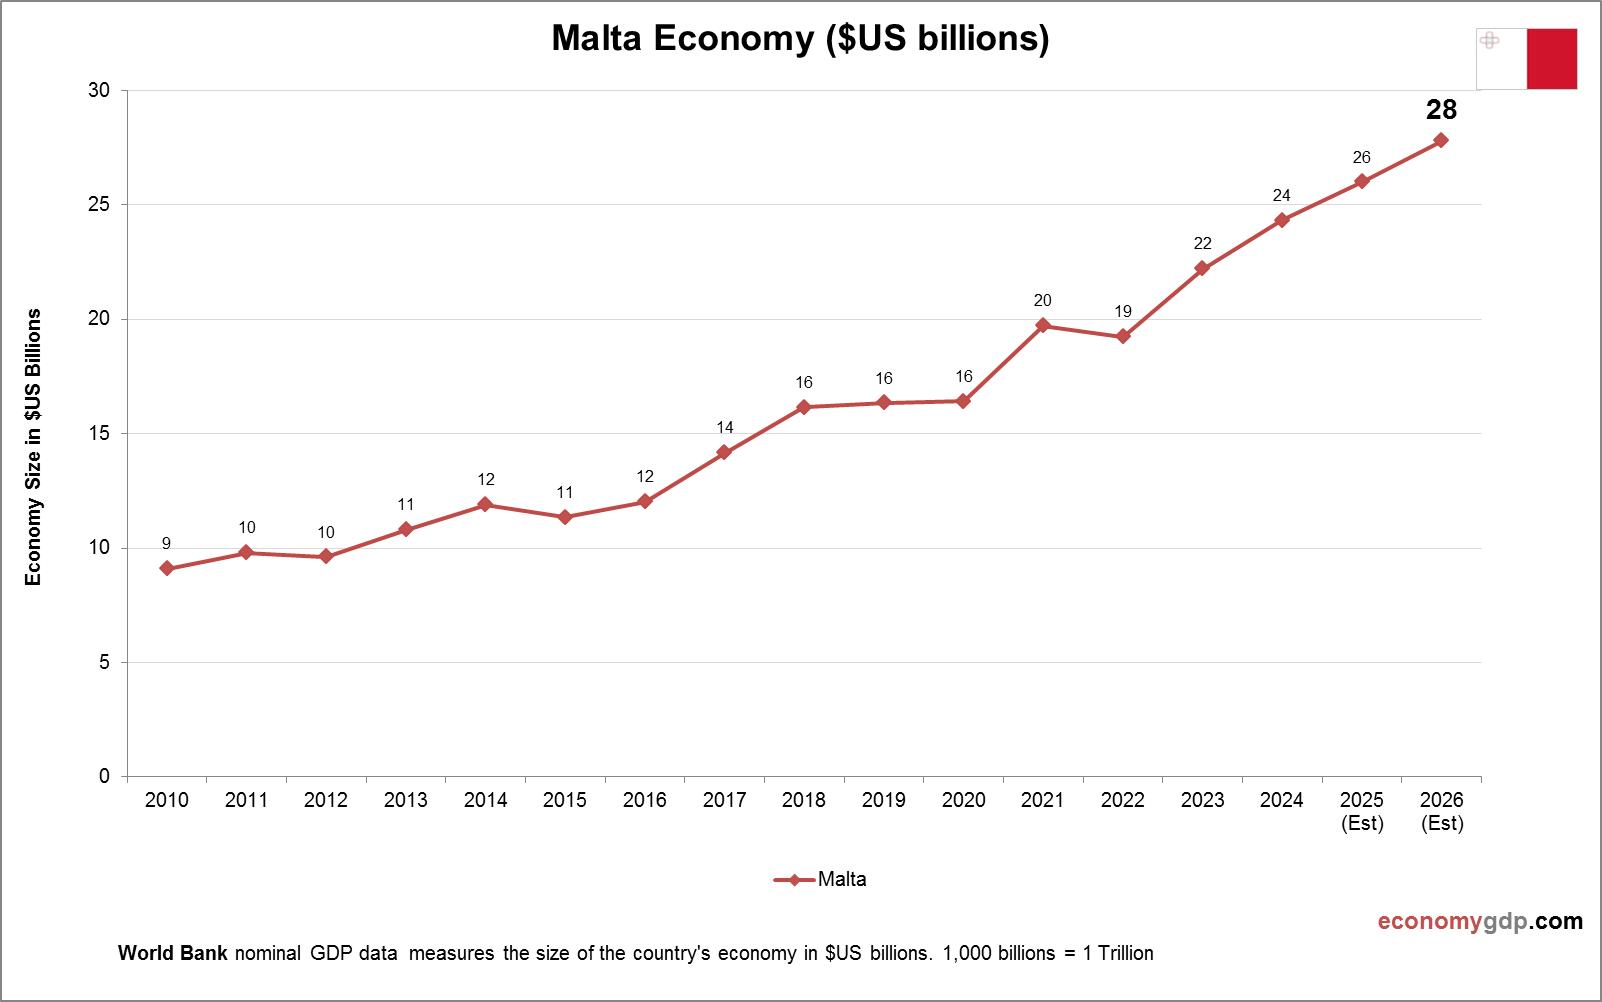
The Malta economy is driven by tourism, financial services, and shipping within the EU. Mediterranean attractions and gaming industries draw visitors, while offshore banking benefits from tax advantages. Maritime trade leverages its strategic location. High public debt and reliance on View diagram Malta Economy in Graphs

Tajikistans GDP (PPP) is projected at $40.1 billion in 2025. Tajikistans economy relies on remittances, agriculture, and aluminum exports, with hydropower potential. The PPP adjustment significantly boosts GDP due to a low cost of living. Poverty, weak infrastructure, and reliance View diagram Tajikistan GDP Purchasing Power Parity

Time Management: Time management refers to the ability to plan and control how much time to allocate to specific activities to increase efficiency and productivity. It involves prioritizing tasks, setting deadlines, and creating schedules to ensure that goals are met View diagram Time Management

Burundi's agrarian economy, with a GDP of $6.75 billion, relies on agriculture, followed by services and industry. Coffee and tea dominate exports, while imports include petroleum and goods. Challenges like unrest, overpopulation, and high unemployment hinder growth. Recent projects, such View diagram Burundi GDP

Cash Flow Diagram Maker Described Example of: A cash flow diagram maker is a tool used to visually represent the movement of cash within a business. It helps illustrate how money flows in and out of the company, including sources View diagram Cash Flow Diagram Maker Described Example of

Customer Segmentation Model Illustration: A customer segmentation model illustration visually represents the division of a customer base into distinct groups based on characteristics like demographics, behaviors, or needs. This illustration may include segments such as high-value customers, potential leads, or View diagram Customer Segmentation Model Illustration