
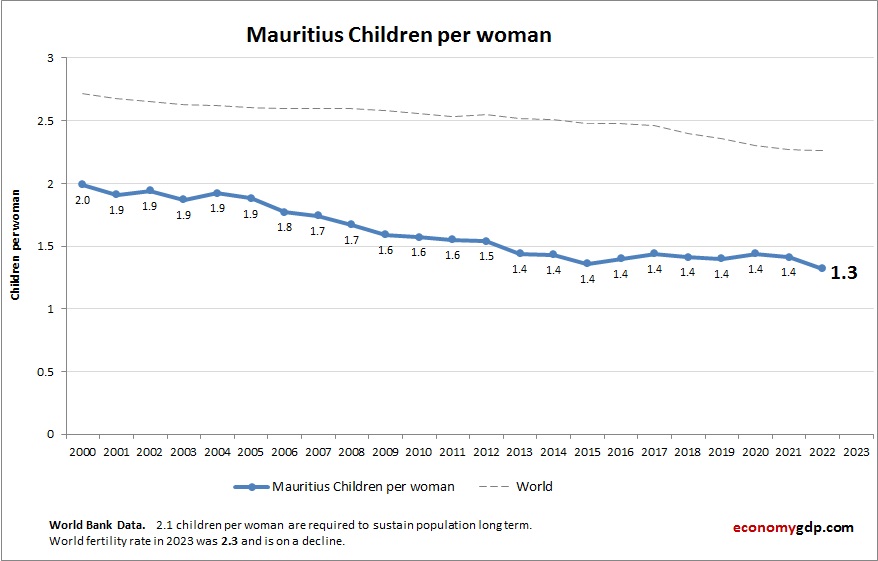
The above graph shows Mauritius Children Per woman. World Bank is the source of this birth data. Based on the latest demographics info provided for Mauritius.
Mauritius has a low children per woman rate. Strong public health and education systems, along with urban lifestyles, have led to smaller families.
Mauritius Children Per woman (Fertility Rate) Statistics by Year
| Year | Children per woman (fertility rate) |
| 2000 | 1.99 |
| 2001 | 1.91 |
| 2002 | 1.94 |
| 2003 | 1.87 |
| 2004 | 1.92 |
| 2005 | 1.88 |
| 2006 | 1.77 |
| 2007 | 1.74 |
| 2008 | 1.67 |
| 2009 | 1.59 |
| 2010 | 1.57 |
| 2011 | 1.55 |
| 2012 | 1.56 |
| 2013 | 1.45 |
| 2014 | 1.44 |
| 2015 | 1.37 |
| 2016 | 1.41 |
| 2017 | 1.46 |
| 2018 | 1.42 |
| 2019 | 1.41 |
| 2020 | 1.46 |
| 2021 | 1.42 |
| 2022 | 1.33 |
| 2023 | 1.40 |
| 2024 | 1.44 |
| 2025 (Est.) | 1.40 |
| 2026 (Est.) | 1.40 |