Skip to content
cropped-economygdp.jpg

Economy GDP

World economy charts, business frameworks and diagrams

Menu

Primary menu

  • Economy
    • Top Economies
  • Demographics
  • Business
    • Strategy
    • Project Management
    • Industry Examples
    • Leadership
    • HR
    • Industry Examples
  • Framework
  • Analysis
  • Lean Six Sigma
    • Lean
  • IT
    • Social Media
  • Marketing
  • Stories
  • Top

Tag Archives: Papua New Guinea statistics

Papua New Guinea GDP PPP

Papua New Guinea GDP PPP

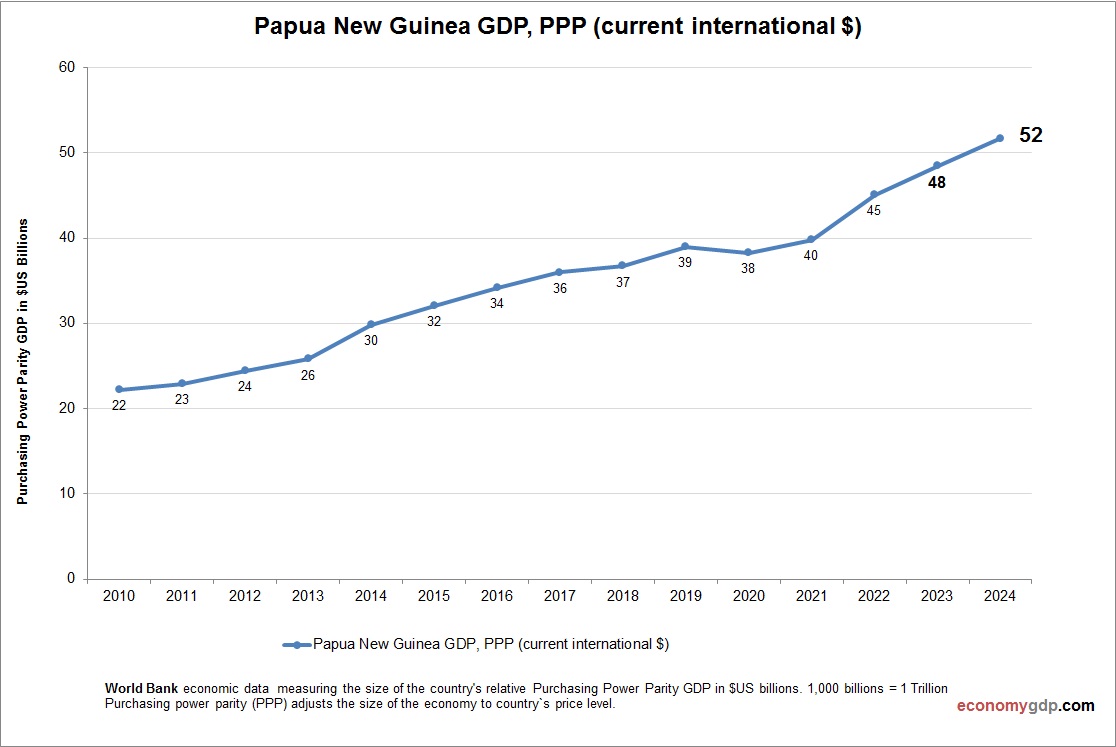
Papua New Guinea’s PPP GDP was $42.3 billion in 2023. Mining, agriculture (coffee, cocoa), and gas exports drive growth, with GDP per capita (PPP) at $4,800. Political instability and weak infrastructure hinder progress, though resource wealth offers potential. Rural poverty View diagram Papua New Guinea GDP PPP→

Posted in Economy | Tagged Papua New Guinea, Papua New Guinea statistics

Papua New Guinea Fertility Rate

Papua New Guinea Fertility Rate

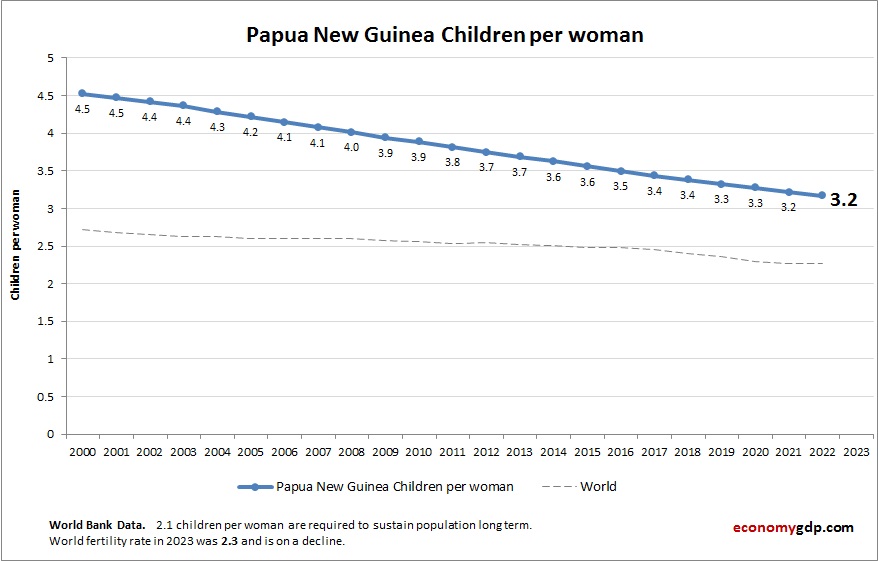
The above graph shows Papua New Guinea Fertility Rate. World Bank is the source of this birth data. Based on the latest available information for Papua New Guinea. Papua New Guinea has a high fertility rate, reflecting traditional family structures View diagram Papua New Guinea Fertility Rate→

Posted in Demographics | Tagged Papua New Guinea demographics, Papua New Guinea statistics

Papua New Guinea GDP Purchasing Power Parity

Papua New Guinea GDP Purchasing Power Parity

Papua New Guinea’s GDP (PPP) is estimated at $41.8 billion in 2025. Papua New Guinea’s economy relies on mining (gold, copper), oil, and agriculture, with LNG exports as a major driver. The PPP adjustment boosts GDP due to a low View diagram Papua New Guinea GDP Purchasing Power Parity→

Posted in Economy | Tagged Papua New Guinea, Papua New Guinea economy, Papua New Guinea GDP, Papua New Guinea statistics

Papua New Guinea Children Per woman

Papua New Guinea Children Per woman

Chart above demonstrates Papua New Guinea Children Per woman. World Bank is the source of this birth data. Latest births per woman information for Papua New Guinea. Women in Papua New Guinea typically have four to five children, due to View diagram Papua New Guinea Children Per woman→

Posted in Demographics | Tagged Papua New Guinea demographics, Papua New Guinea statistics

Primary Sidebar Widget Area

Top Diagrams

Latest Posts

  • The Philippines’ Economy – Run on Remittances and Call Centres
  • Steps in Agile Methodology Illustration
  • Mauritius GDP PPP
  • Malaysia’s Economy – Packaging the World’s Chips
  • Malta Inflation
  • St. Lucia Children Per woman
  • Thailand’s Economy – Chips Up, Tourists Down
  • Equatorial Guinea GDP per capita
  • The UAE’s Economy – The Oil State That Outgrew Oil
  • Vanuatu GDP
  • Finland GDP PPP
  • Benin GDP
  • Portugal GDP PPP
  • Ireland’s Economy – Twice as Rich on Paper
  • Research Methodology for ASD
  • Twitter
Copyright © 2026 Economy GDP. All Rights Reserved.
Theme: Catch Box by Catch Themes
Scroll Up