
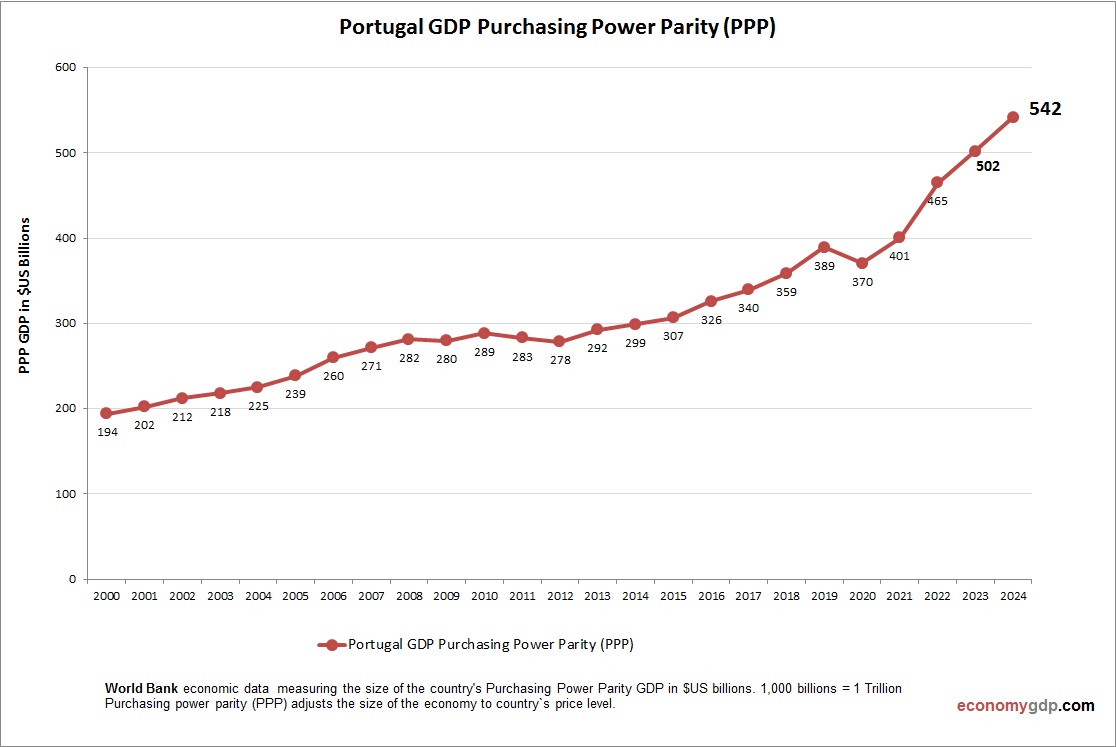
Portugals PPP GDP was $415.5 billion in 2023. Tourism, manufacturing, and services drive the economy, with GDP per capita (PPP) at $40,900. EU membership supports trade, but high debt and an aging population pose risks. Renewable energy and tech sectors are growing, enhancing long-term stability. See all Portugal economy graphs.
Portugal GDP PPP Statistics by Year
| Year | GDP, Purchasing Power Parity (PPP) |
| 2000 | 194.3 |
| 2001 | 202.4 |
| 2002 | 212.1 |
| 2003 | 218.1 |
| 2004 | 225.1 |
| 2005 | 238.7 |
| 2006 | 259.7 |
| 2007 | 271.4 |
| 2008 | 281.5 |
| 2009 | 279.8 |
| 2010 | 288.6 |
| 2011 | 283.0 |
| 2012 | 278.4 |
| 2013 | 292.4 |
| 2014 | 299.2 |
| 2015 | 306.7 |
| 2016 | 326.2 |
| 2017 | 339.6 |
| 2018 | 358.9 |
| 2019 | 389.5 |
| 2020 | 370.4 |
| 2021 | 400.6 |
| 2022 | 472.2 |
| 2023 | 522.1 |
| 2024 | 552.7 |
| 2025 (Est.) | 575.0 |
| 2026 (Est.) | 600.0 |